Dashboards
How to read a Folio dashboard, filter it, and build one from your reports.
Overview
A dashboard puts several reports on one page. Each tile shows a saved report as a chart, a number, or a table, and tiles can also hold a heading or a note. Filters across the top narrow the tiles they apply to. One dashboard can mix sources, such as a Salesforce report beside a Consumer Health one.
A dashboard is shared like a report. See Collections and Sharing. A tile shows only to someone who can open its report. Anyone else sees This report isn't shared with you. on it. Nothing of the report shows.
Reading a dashboard
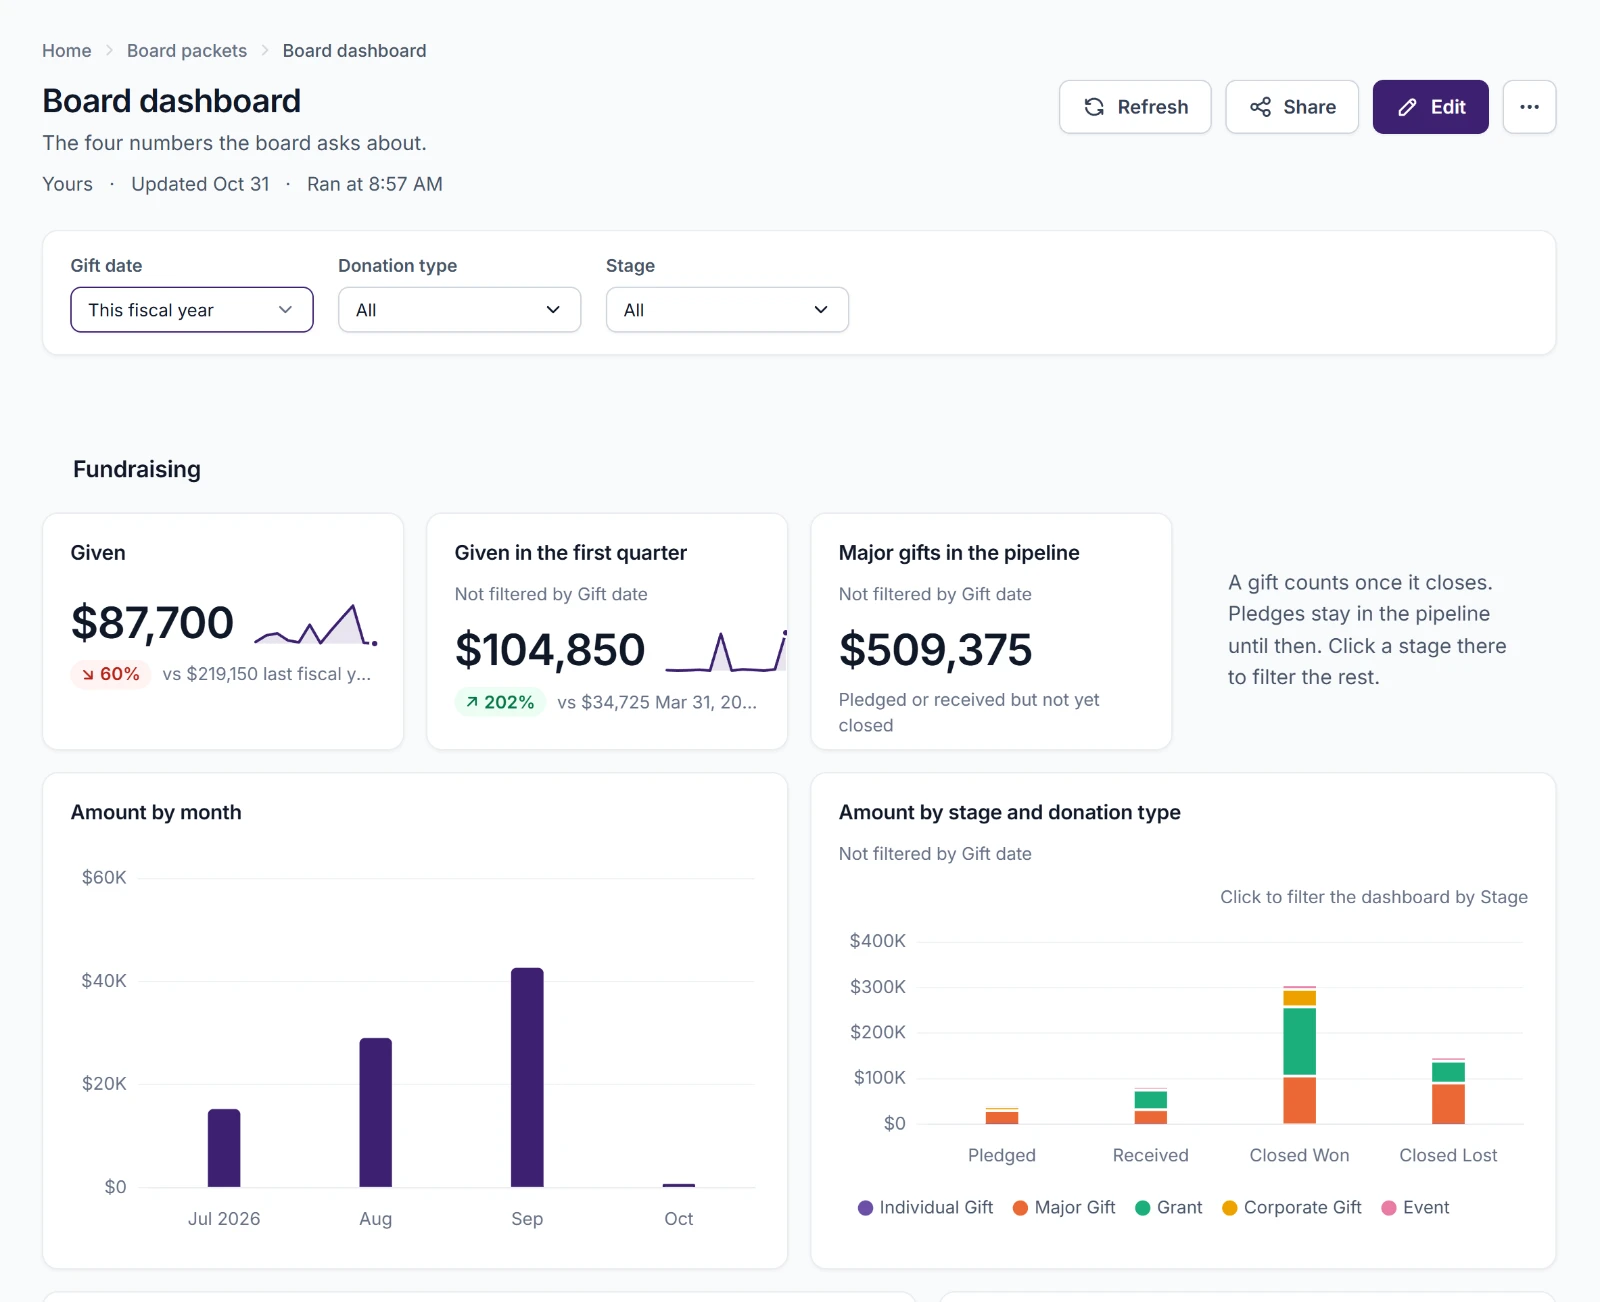
At the top are the dashboard's name, its description, who owns it, when it last changed, and Ran at with the time its tiles last ran. Refresh runs every tile again. Share, Edit, and the … menu work as they do on a report.
Tiles fill in a few at a time. A tile still waiting shows its shape until its numbers come. When a tile runs again, it keeps its last numbers faded until the new ones arrive.
Filters
Each filter in the bar narrows the tiles it applies to.
| Filter | How you set it |
|---|---|
| A list of choices | Pick one or tick several in its list. All or Show all clears it. |
| Dates | Pick a period, such as This month or Last 90 days, or Custom dates… to enter a start and an end and choose Apply. All dates clears it. |
| Yes or No | Yes, No, or All. |
Reset filters puts every filter back where the dashboard starts it.
The page's address keeps the filters. Bookmark a filtered dashboard or send its address, and it opens filtered the same way.
When a filter is set but doesn't apply to a tile, the tile says so under its title, such as Not filtered by Gift date.
Tiles
A chart tile is its report's chart. If the hint above it says Click to filter the dashboard by a filter, choosing a bar sets that filter for the whole dashboard. The tile marks your choice, and the tiles the filter applies to narrow to it. Choose it again to clear it.
A number tile is one total in large type. Beneath it is one line:
- When the tile compares, its change from the period before, with an arrow up or down, such as "60% vs $219,150 last fiscal year." The period before is the one just before the dashboard's date filter or the report's own date range.
- Otherwise the tile's subtitle.
- Otherwise how many records it's over, such as "Across 10 records."
A number can have a trend line beside it. The line shows the number week by week over the last 12 weeks when the number covers three months or less, and month by month over the last 12 months otherwise. Point at the line to read which.
A table tile is its report's table, scrolling inside the tile.
A heading or a note is text the dashboard's builder wrote.
Point at a tile to see its tools:
- Show as a table switches a chart to its numbers, and Show as a chart switches back.
- Open the report opens the report behind the tile.
A tile with nothing in it says Nothing to show. A tile whose report was deleted says This tile's report no longer exists. A tile whose source can't be used says why. See When a source stops working.
Building a dashboard
Building dashboards needs the creator role, and a dashboard needs reports to show. With none you can open, the editor says No reports to show yet.
- On Home, choose New dashboard. Inside a collection, New dashboard makes the dashboard in that collection.
- Type a name where it says Name this dashboard.
- Add tiles and filters on the tabs on the left.
- Choose Save.
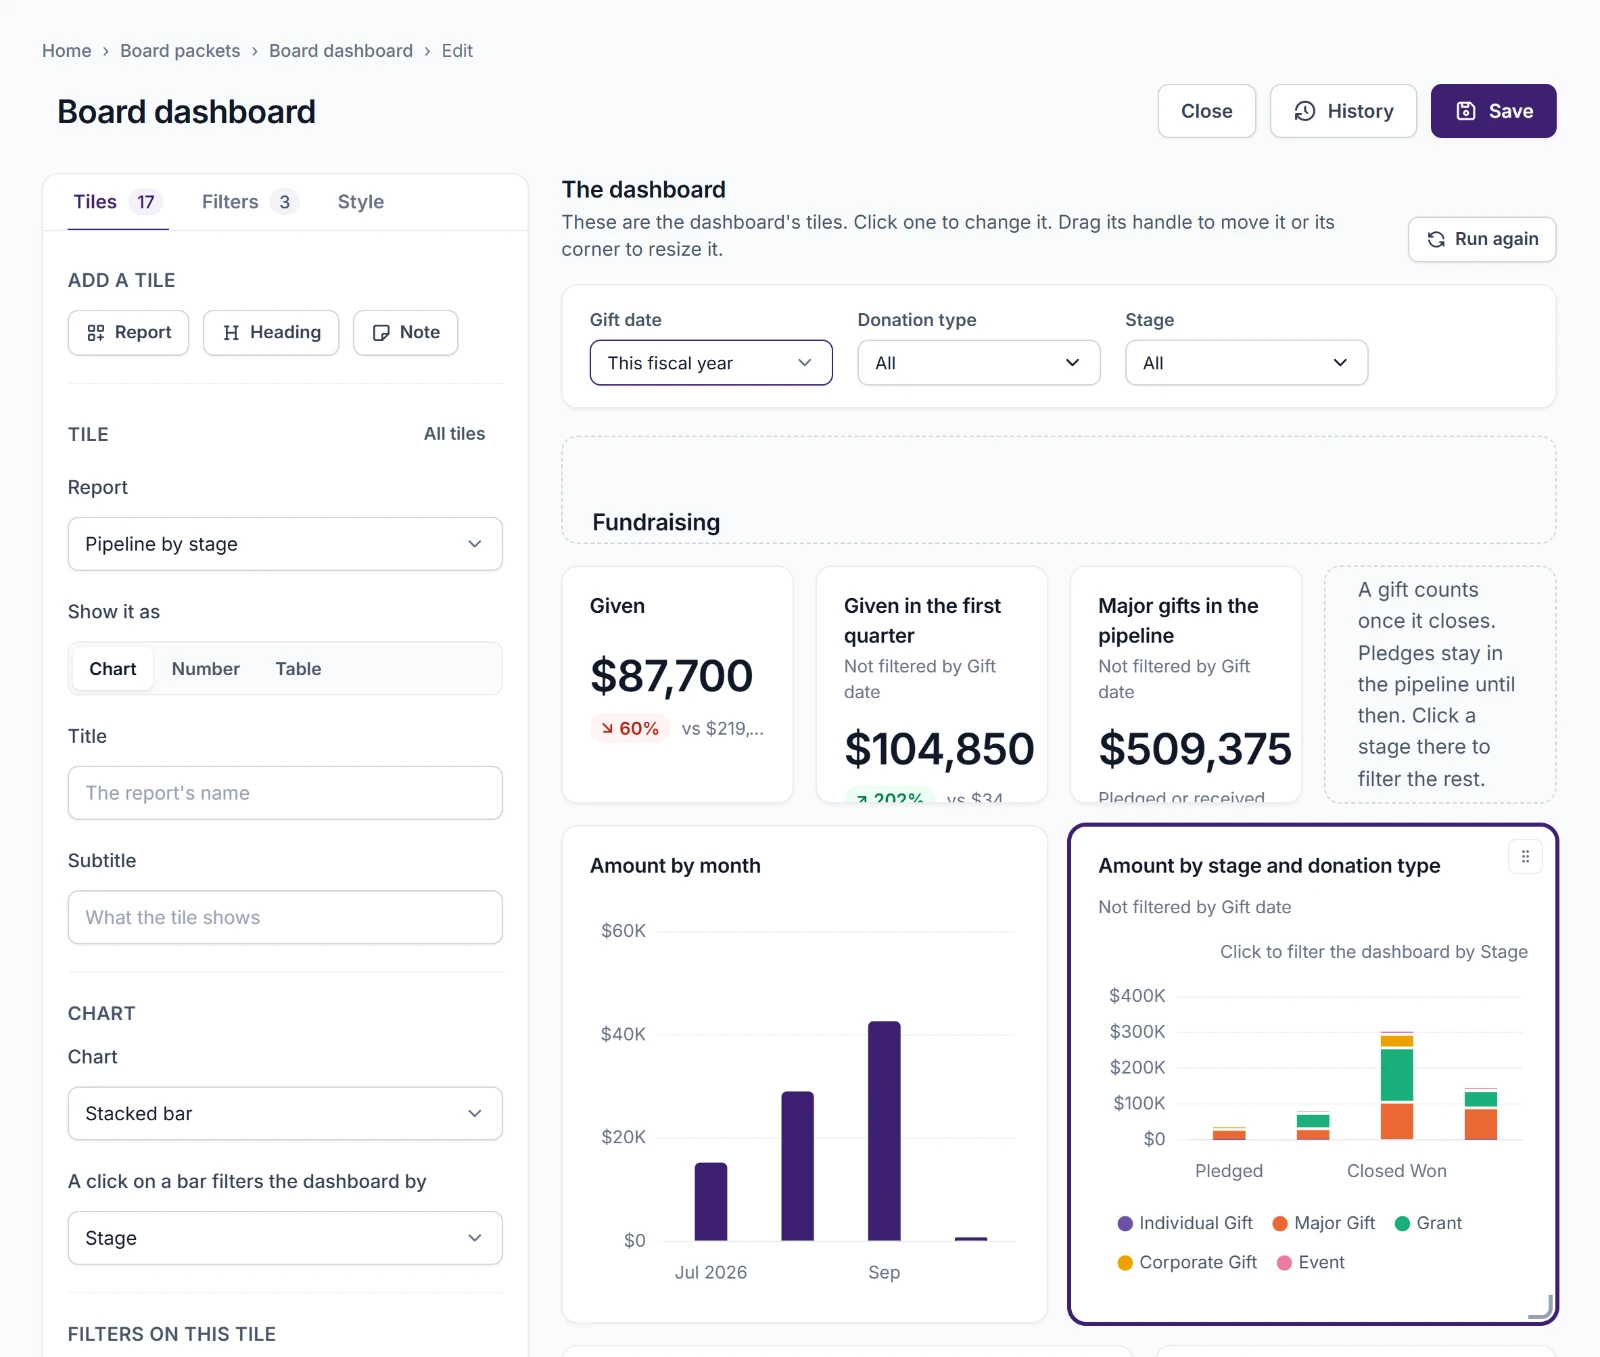
The right side is The dashboard itself. Its tiles run as they stand. Choose a tile to change it. Drag its handle to move it among the others or its corner to resize it. On the keyboard, the arrow keys on a tile's handle move it. Run again runs every tile again.
Tiles
Under Add a tile, choose Report, Heading, or Note. The new tile is chosen, and its settings open on the left. All tiles goes back to the list of tiles.
| Setting | |
|---|---|
| Report | The report the tile shows. You choose among the reports you can open. |
| Show it as | Chart, Number, or Table. A chart needs a report with groups and a summed-up column, and a number needs a summed-up column. |
| Title | Left blank, the tile is named for what it shows. |
| Subtitle | A line under the title or under a number. |
Filters on this tile lists the filters that reach it. You choose them on the Filters tab.
A heading or a note has only its Text and its Look, Heading or Note.
A chart tile
| Setting | |
|---|---|
| Chart | Same as the report, or another type the report allows. |
| What it charts | With several summed-up columns, which one the chart plots. |
| Show a running total that adds each point to the ones before it | A line over a sum or a count. |
| How many bars it shows | Ranked bars only. As many as fit, or The top 3, 5, 10, 15, or 20, with the rest added together on one row. |
| A click on a bar filters the dashboard by | A list filter that this tile applies on its first grouping. Choosing a bar then sets that filter. |
A number tile
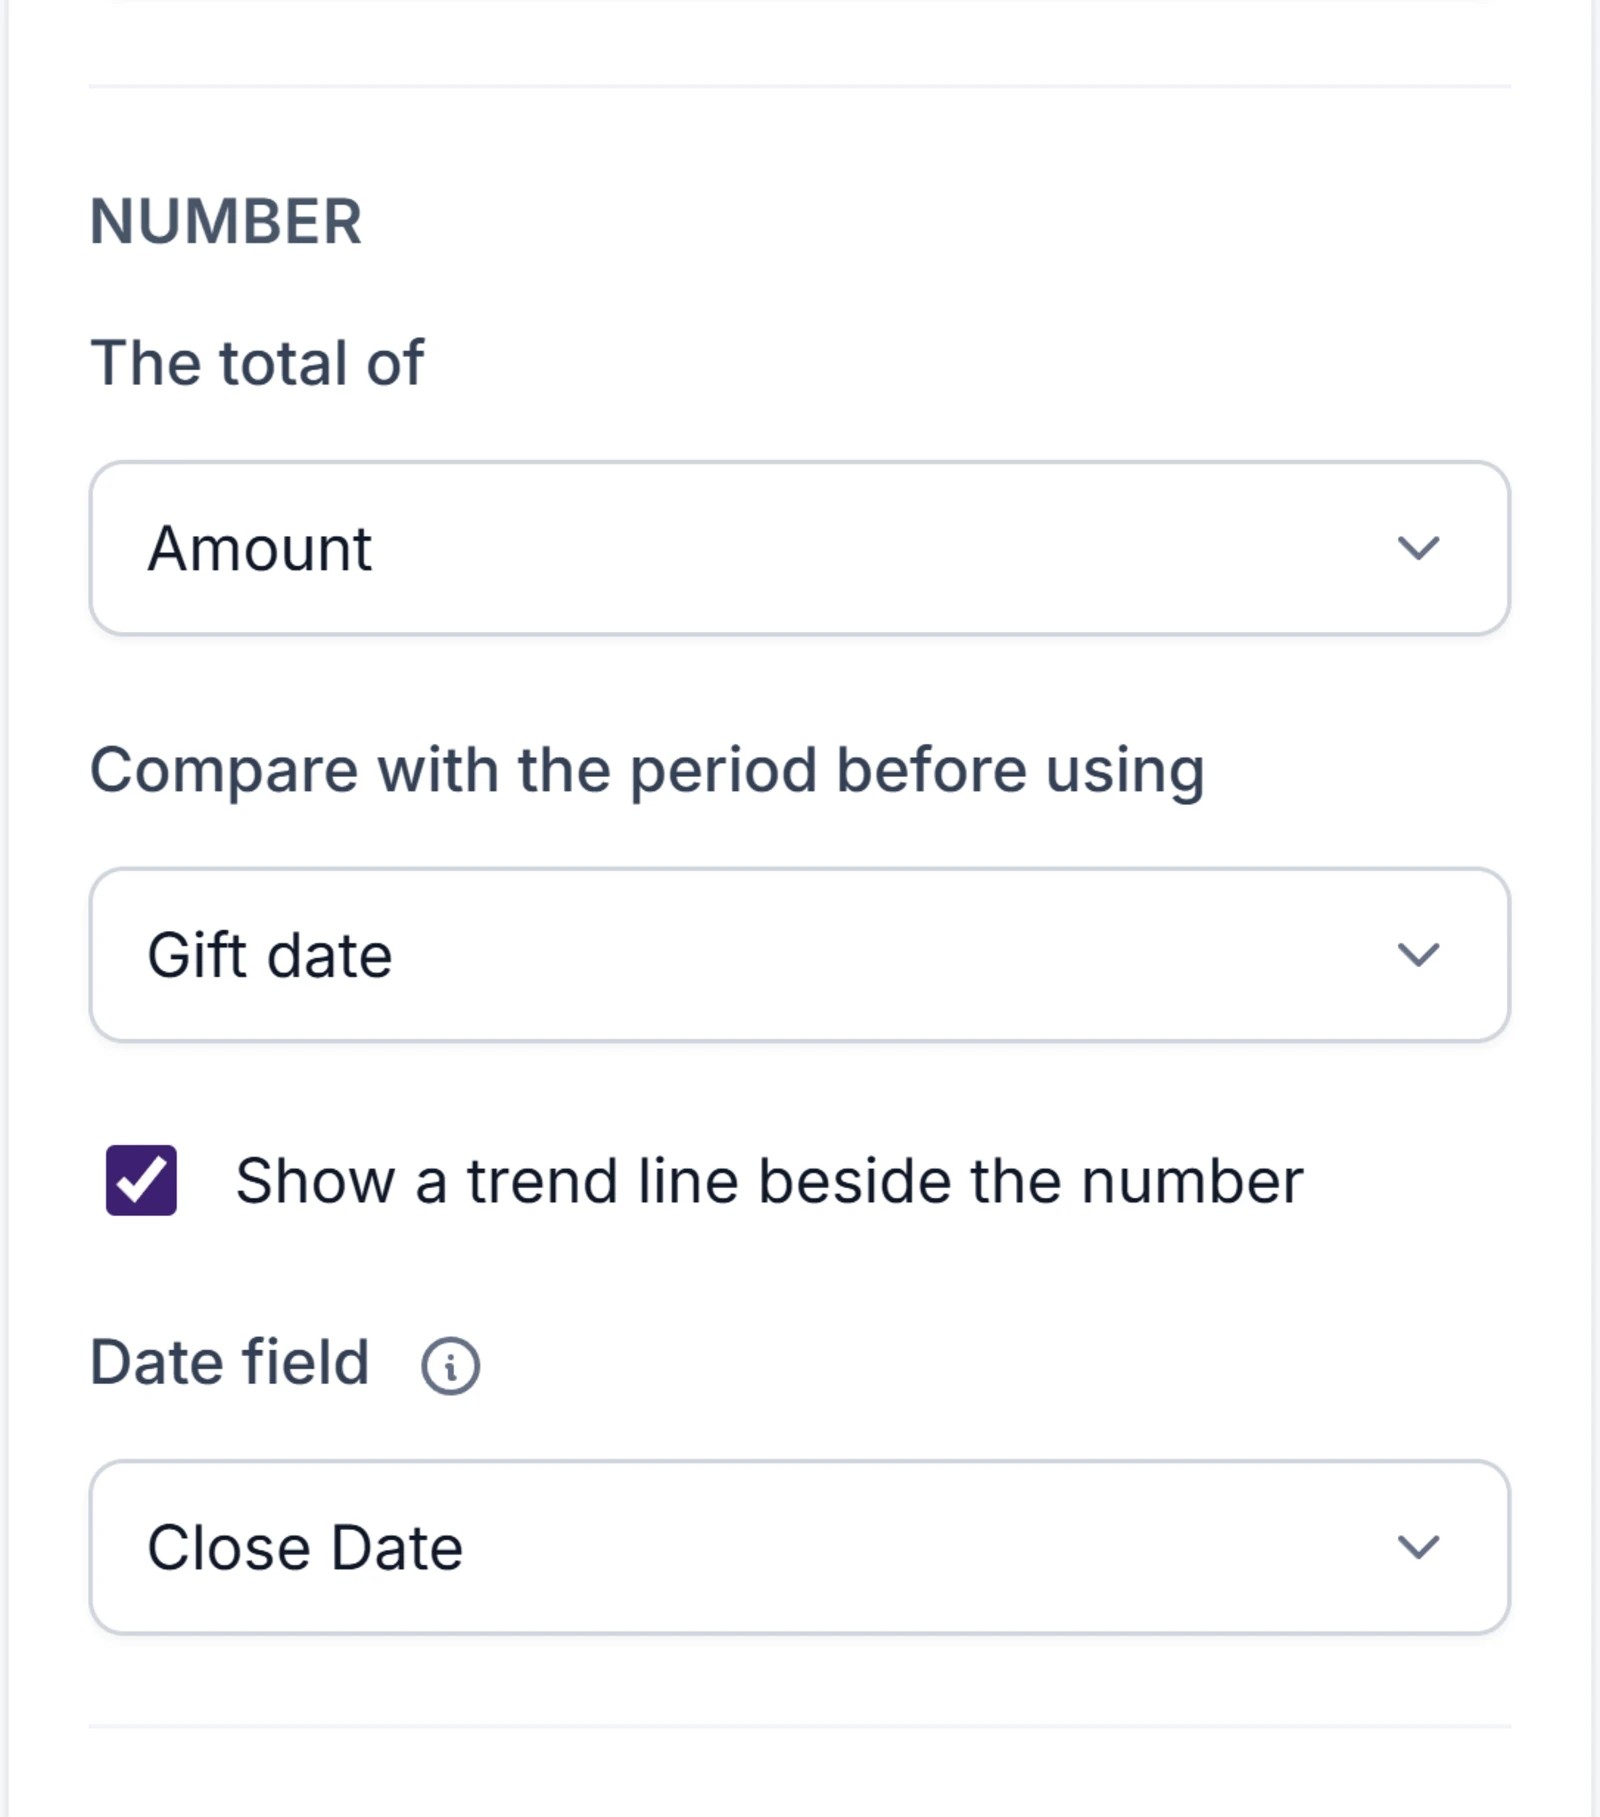
| Setting | |
|---|---|
| The total of | Which summed-up column the number shows. |
| Compare with the period before using | Don't compare, the report's own date range (This report's own dates), or a date filter that applies to the tile. The tile then shows its change from the period before. |
| Show a trend line beside the number | Draws the number's trend along a Date field of its report. |
Size and place
A dashboard is 12 columns wide. Besides dragging, a chosen tile has Width (1 to 12 columns) and Height (in rows), and Earlier and Later to move it one place. Remove this tile takes it off the dashboard.
Filters
On the Filters tab, choose Add a filter. Each filter shows in the bar above the dashboard.
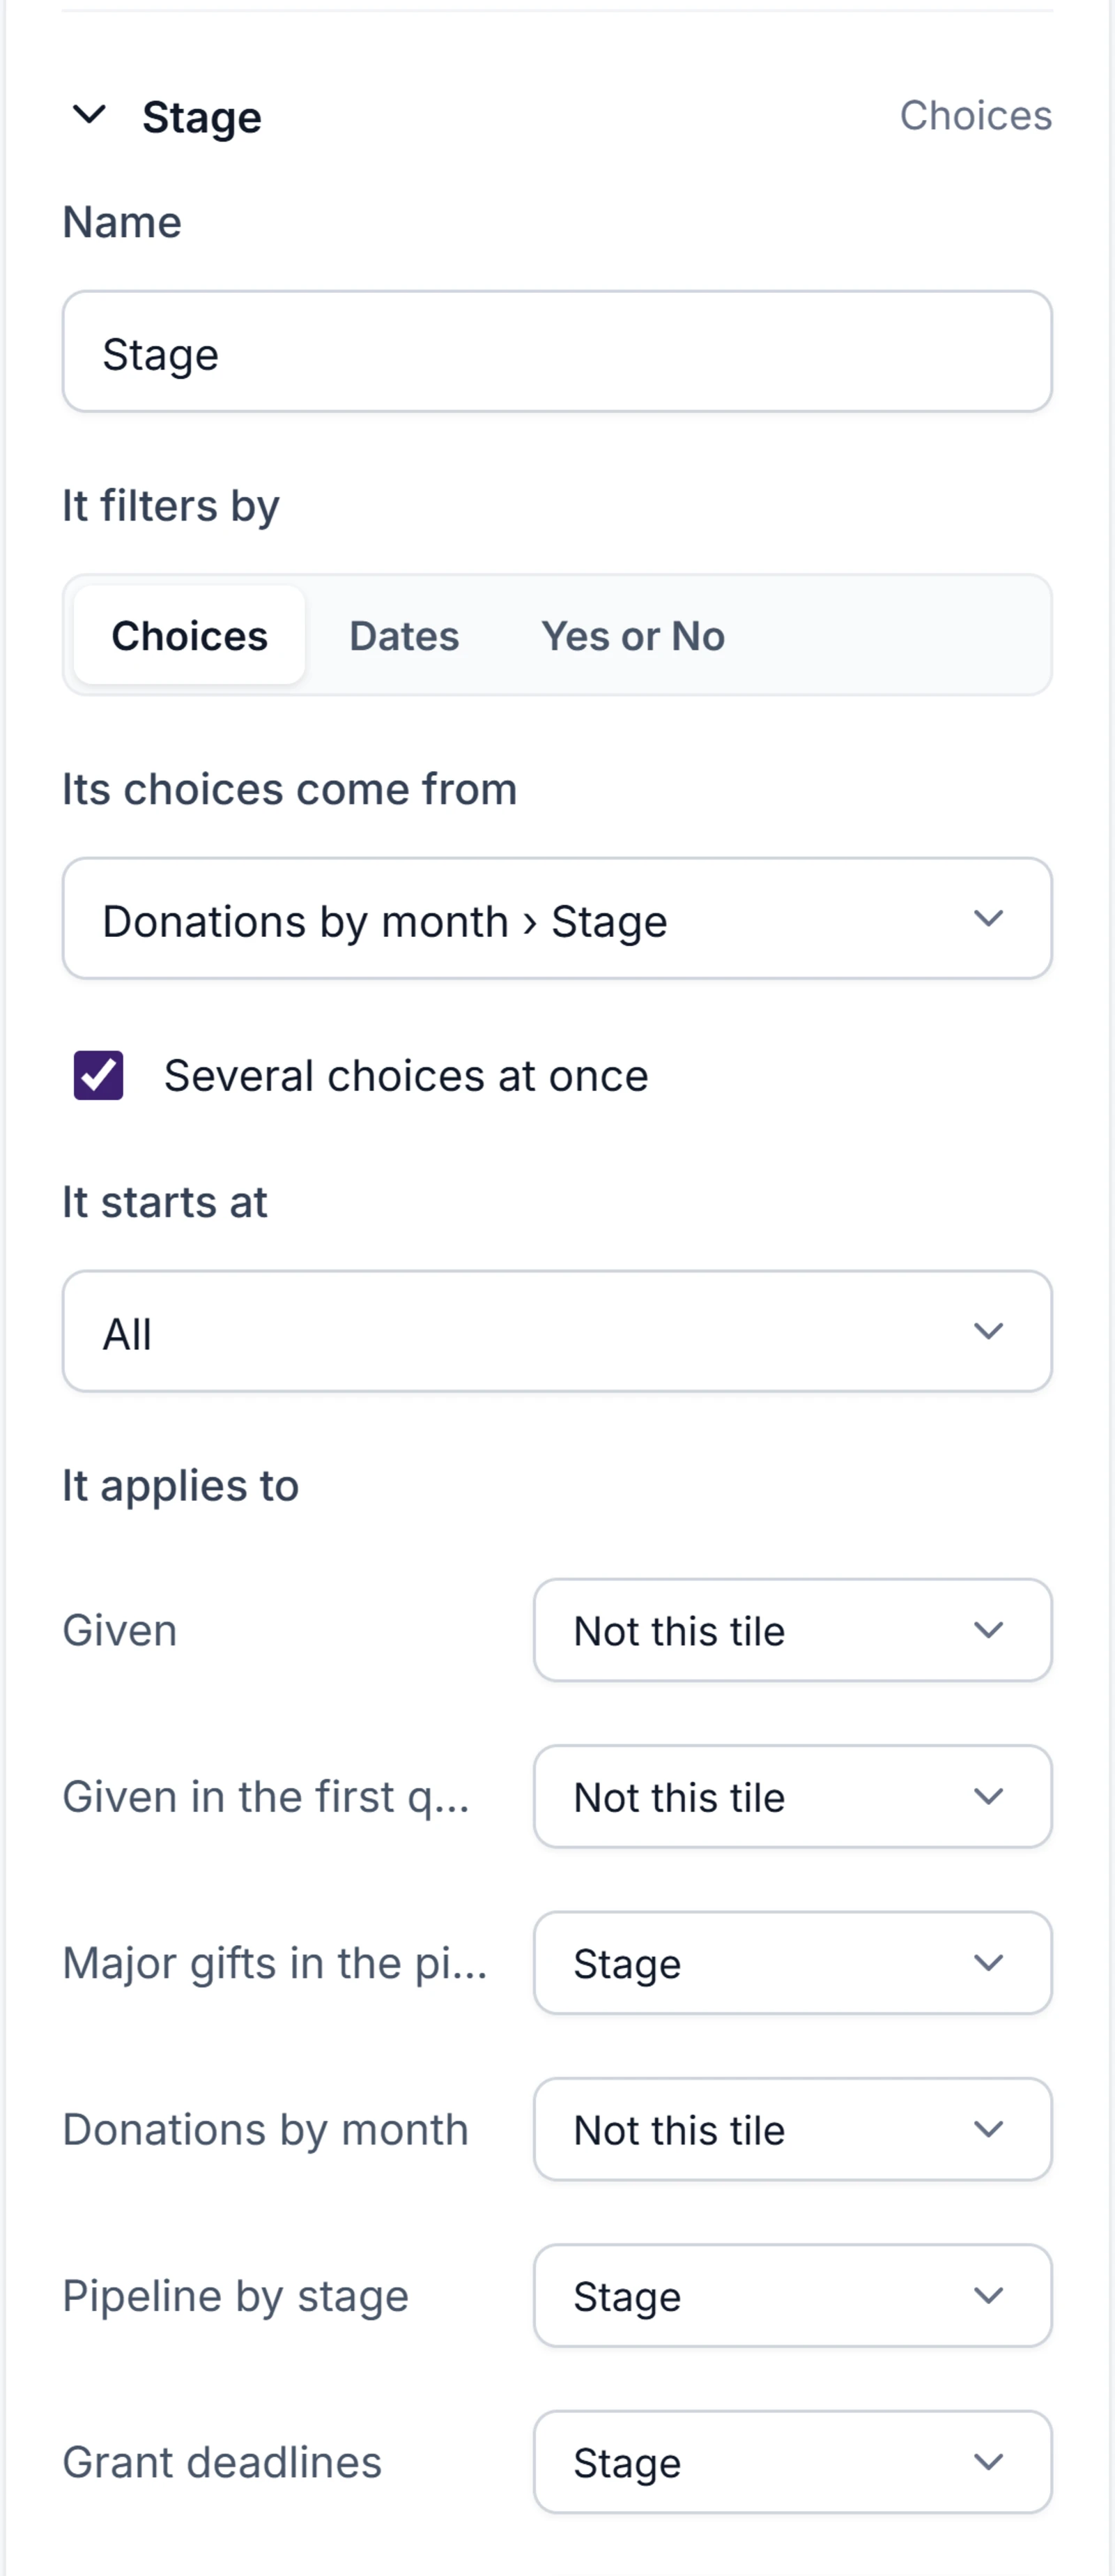
| Setting | |
|---|---|
| Name | What the bar calls it, such as Region. |
| It filters by | Choices, Dates, or Yes or No. |
| Its choices come from | Choices only. A list field of one of the tiles' reports, such as a stage or a status. Another field of a report finds one that isn't offered. |
| Several choices at once | Choices only. Lets readers tick more than one. |
| It starts at | The value the dashboard opens with. All starts it cleared. |
| It applies to | For each report tile, the field of that tile's report the filter narrows, or Not this tile. |
A filter narrows each tile by a field of that tile's own report, so one filter can reach reports on different objects or different sources.
If you build on a report's source, Another field… under It applies to finds any field of its object, a looked-up record's field included. Otherwise you choose among the fields the report shows.
Remove this filter takes it off the dashboard and off every tile.
Style
Color sets the dashboard's color. Every tile uses it even if its report has its own. Left blank, the dashboard uses the organization's report color. Description says what the dashboard is for and who reads it.
Saving
Choose Save. Folio says what's missing first, such as Choose the report each tile shows. or Give each filter a name.
Saving, leaving with changes not saved, and History work as they do for reports. See Saving.