Reading Reports in Salesforce
How reading a Folio report in Salesforce differs from Folio on the web: whose access it reads with, how it looks, and what its tools are called.
Overview
A report looks the same wherever it's placed in Salesforce: on the Folio Reports tab, on a Lightning page, in a Flow, or on an Experience site. Its table, sorting, chart, filtering from the chart, and exports work as they do on the web. See Reading Reports. This page covers only what's different.
A report reads Salesforce as the person looking at it. Everything they see is limited to the records and fields they can see in Salesforce, so two people opening the same report can see different rows. The one exception is a report marked Run Elevated, which is for public sites. See Placing Reports.
How it looks
From the top, a report in Salesforce has:
- The utility bar with the tools the report offers.
- The title on a banner in the report's brand color.
- An optional header strip of labels and values, such as Owner and Region. On the web, these are the facts above the report.
- A line such as "120 records · Summary," which the report can hide.
- An optional chart.
- The table.
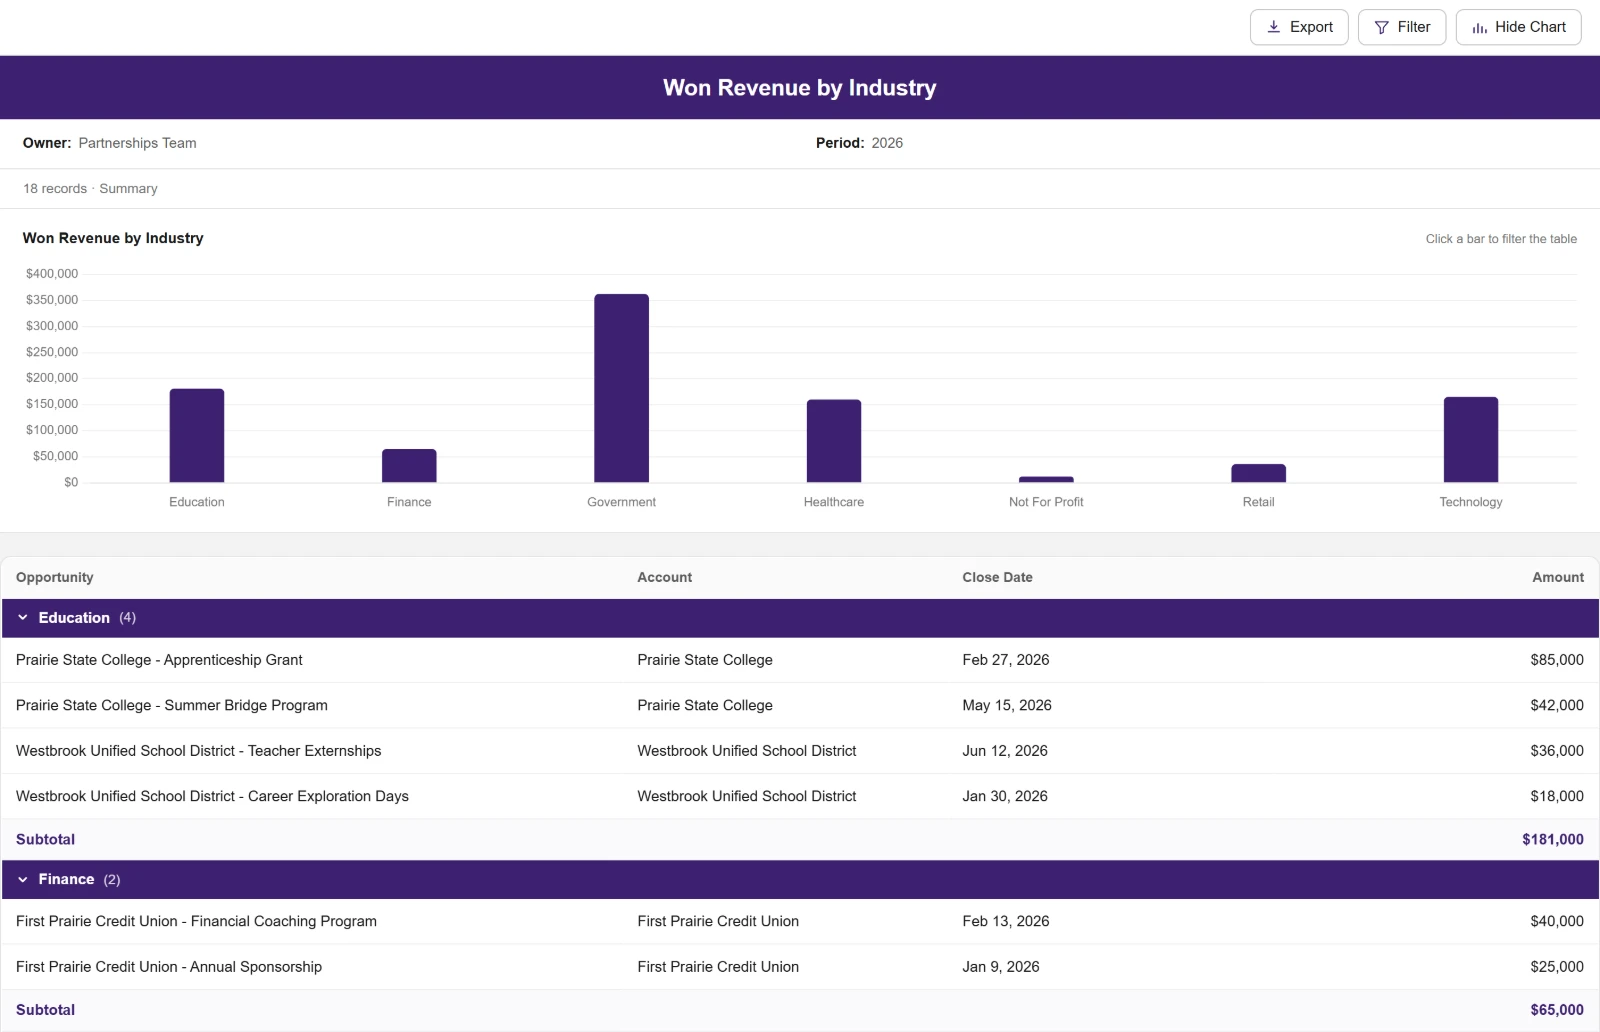
Only summary and matrix reports have charts in Salesforce. A summary has one level of groups.
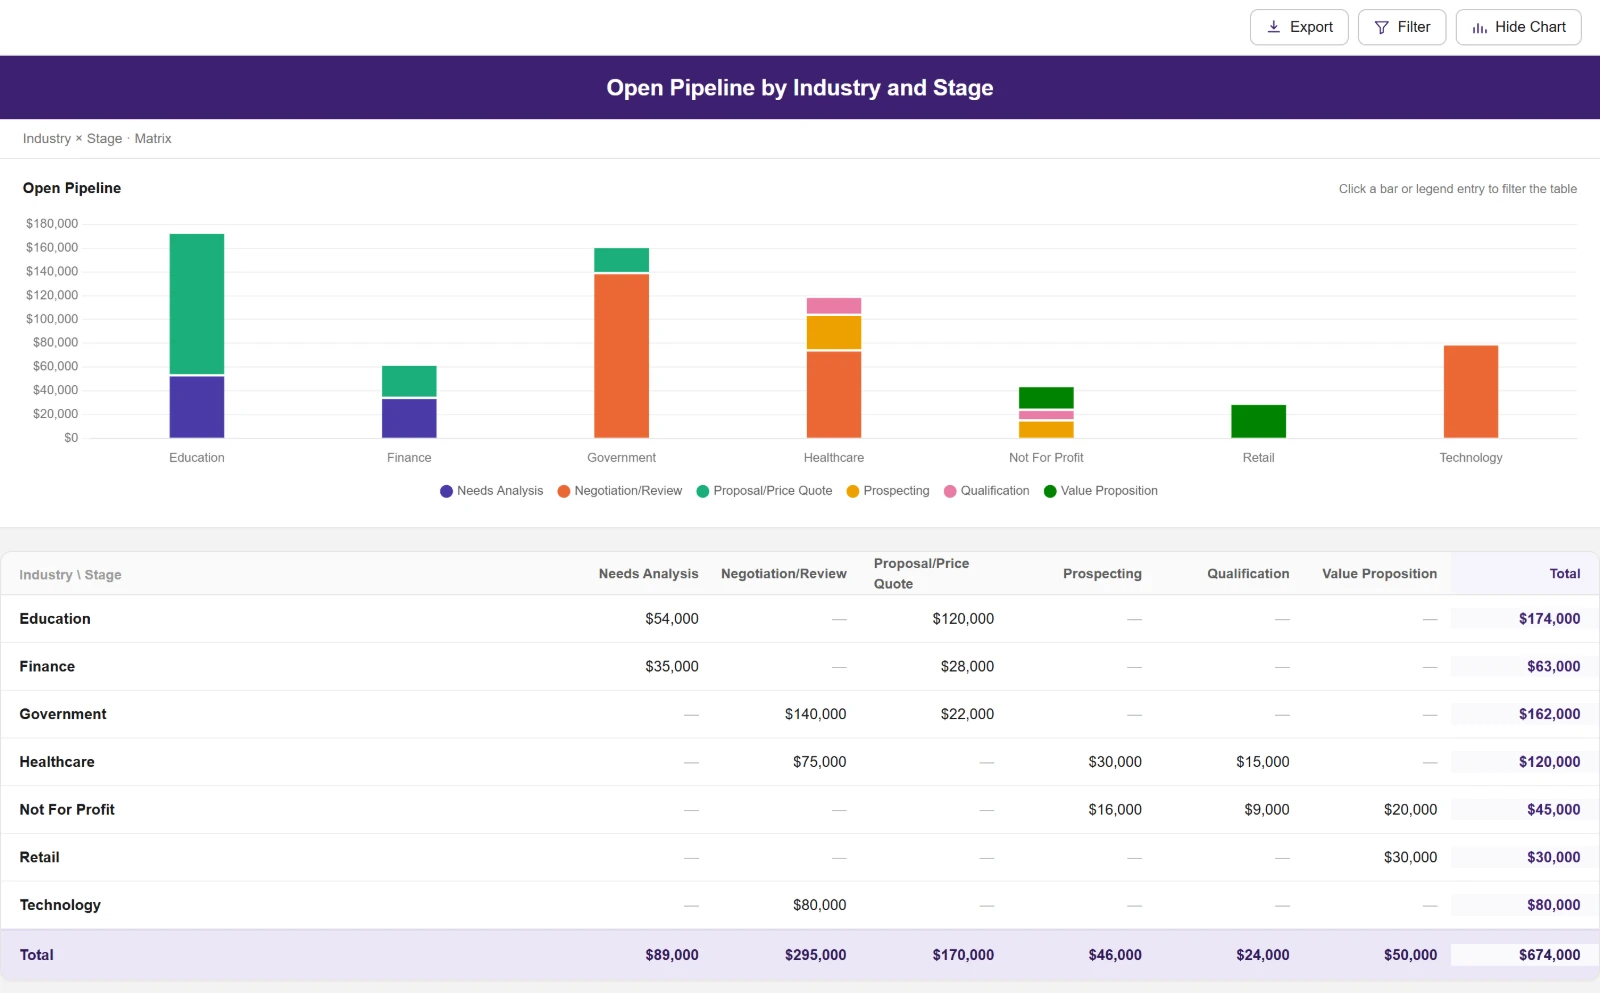
The utility bar
The tools are Export, Filter, and Hide Chart or Show Chart. Where the report is placed can narrow its tools further. See The Utility Bar setting.
Filtering
Filter opens Filter report. Click + Add filter, pick a field, an operator, and a value, and click Apply. Clear removes your filters. The operators are the Editor's. See Filters.
You can filter only on fields of the report's own object. A report whose data comes from somewhere other than Salesforce has no Filter because there's nothing to run again. See Supplying the data yourself.
Exporting
Export opens Export report, with Excel (Simple), Excel (Formatted), PDF, CSV, and Copy as JSON. The formats and their limits are the web's. See Exporting.
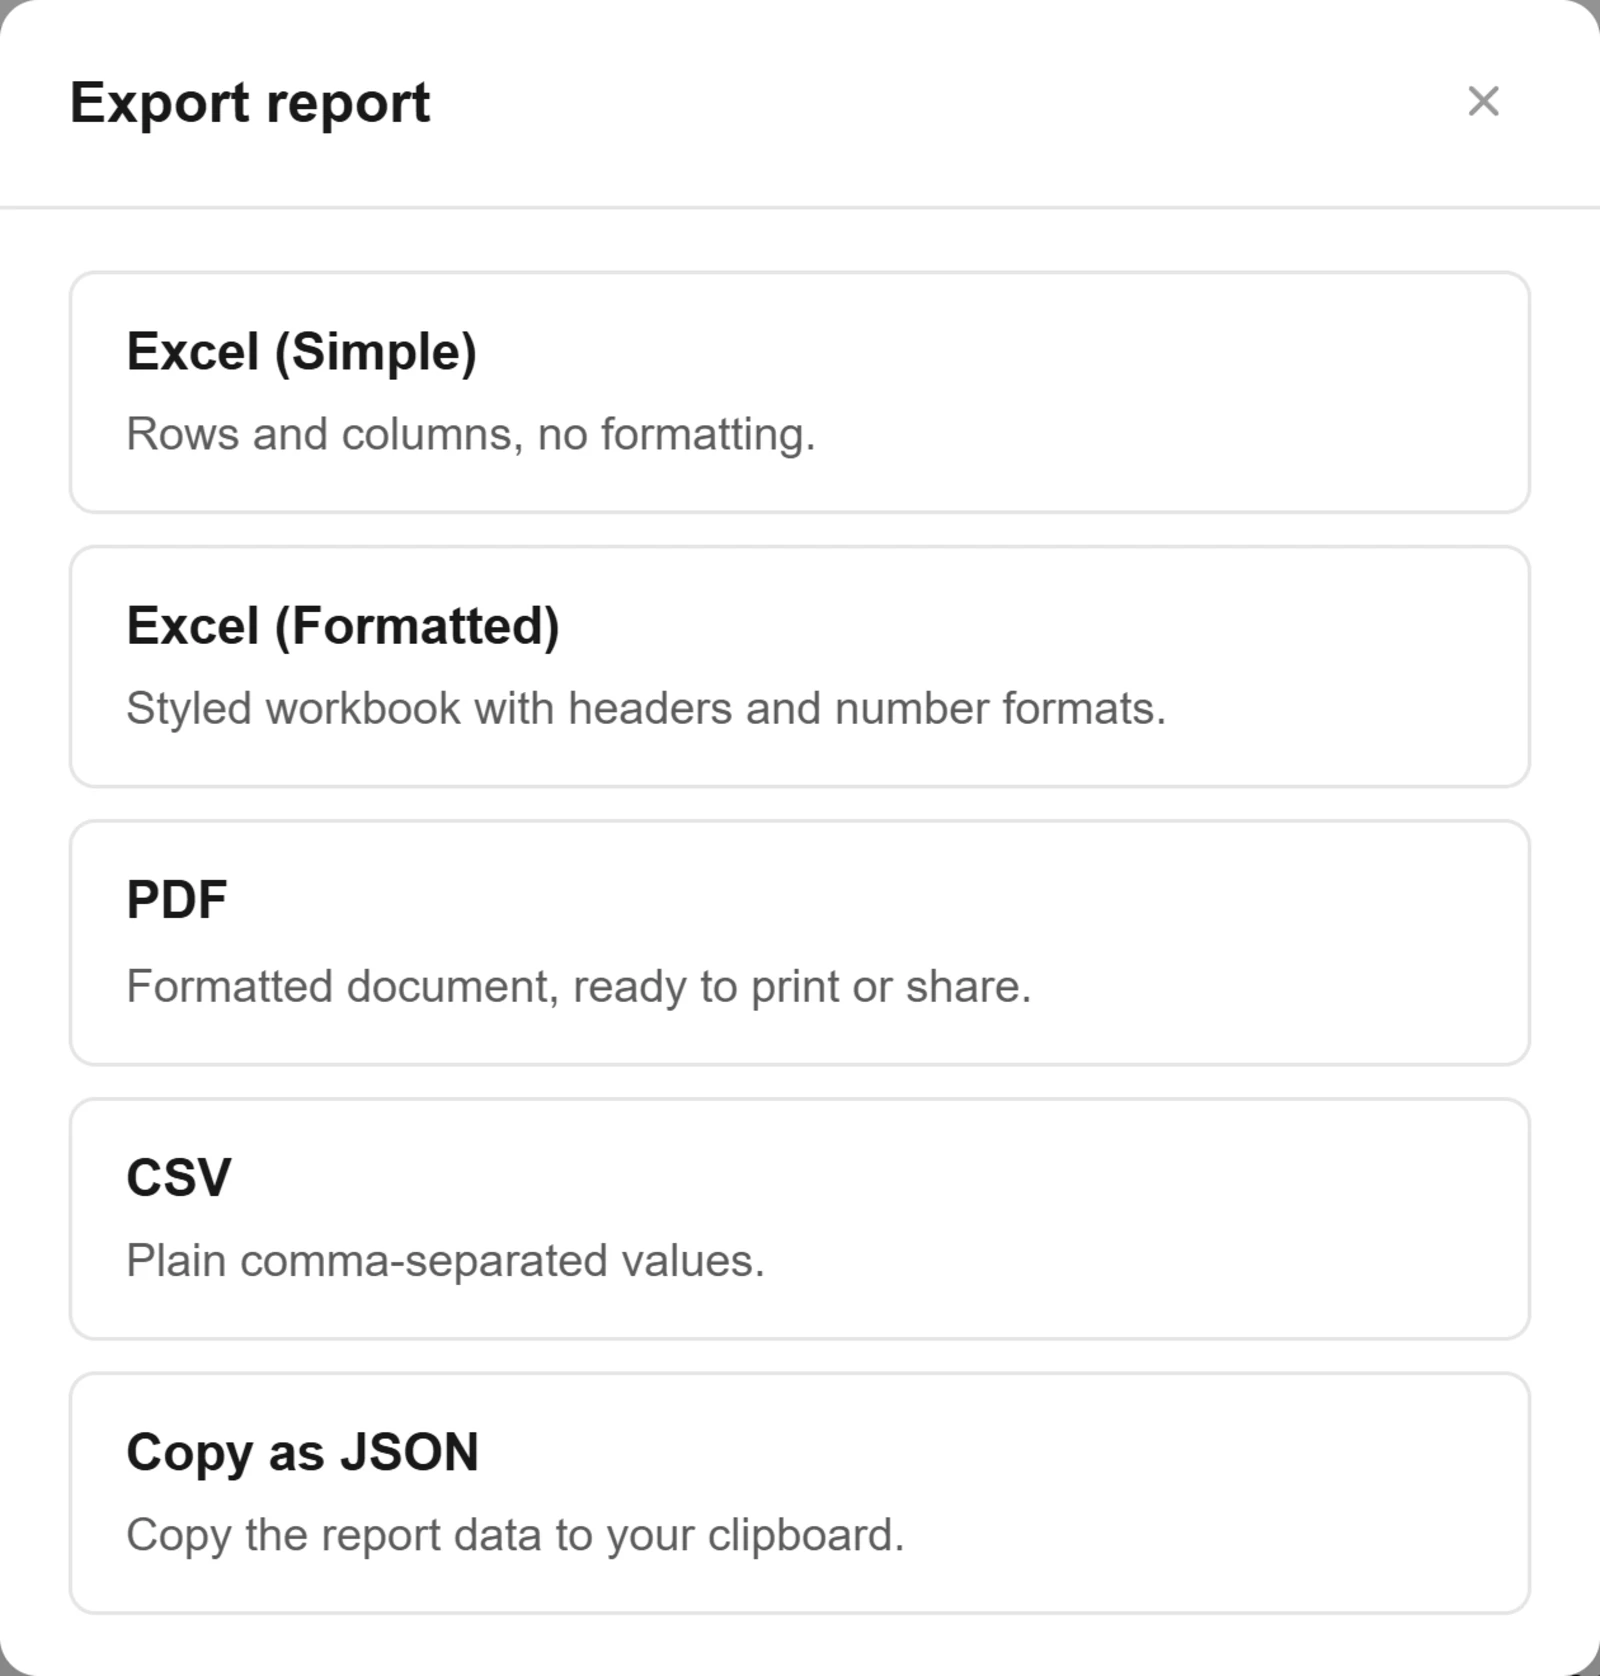
The formatted exports carry the report's cell and header coloring, too, which a report sets in its JSON.