Insights
How to read what a campaign's answers add up to: its numbers, the summary, and the charts.
Overview
Insights in a campaign's Manage group adds up its answers. The counts cover every answer and are worked out each time you open it. Hidden answers are left out. Insights updates by itself while answers are on their way or a newer summary is being written.
Everyone with a role can read Insights.
The numbers and the summary
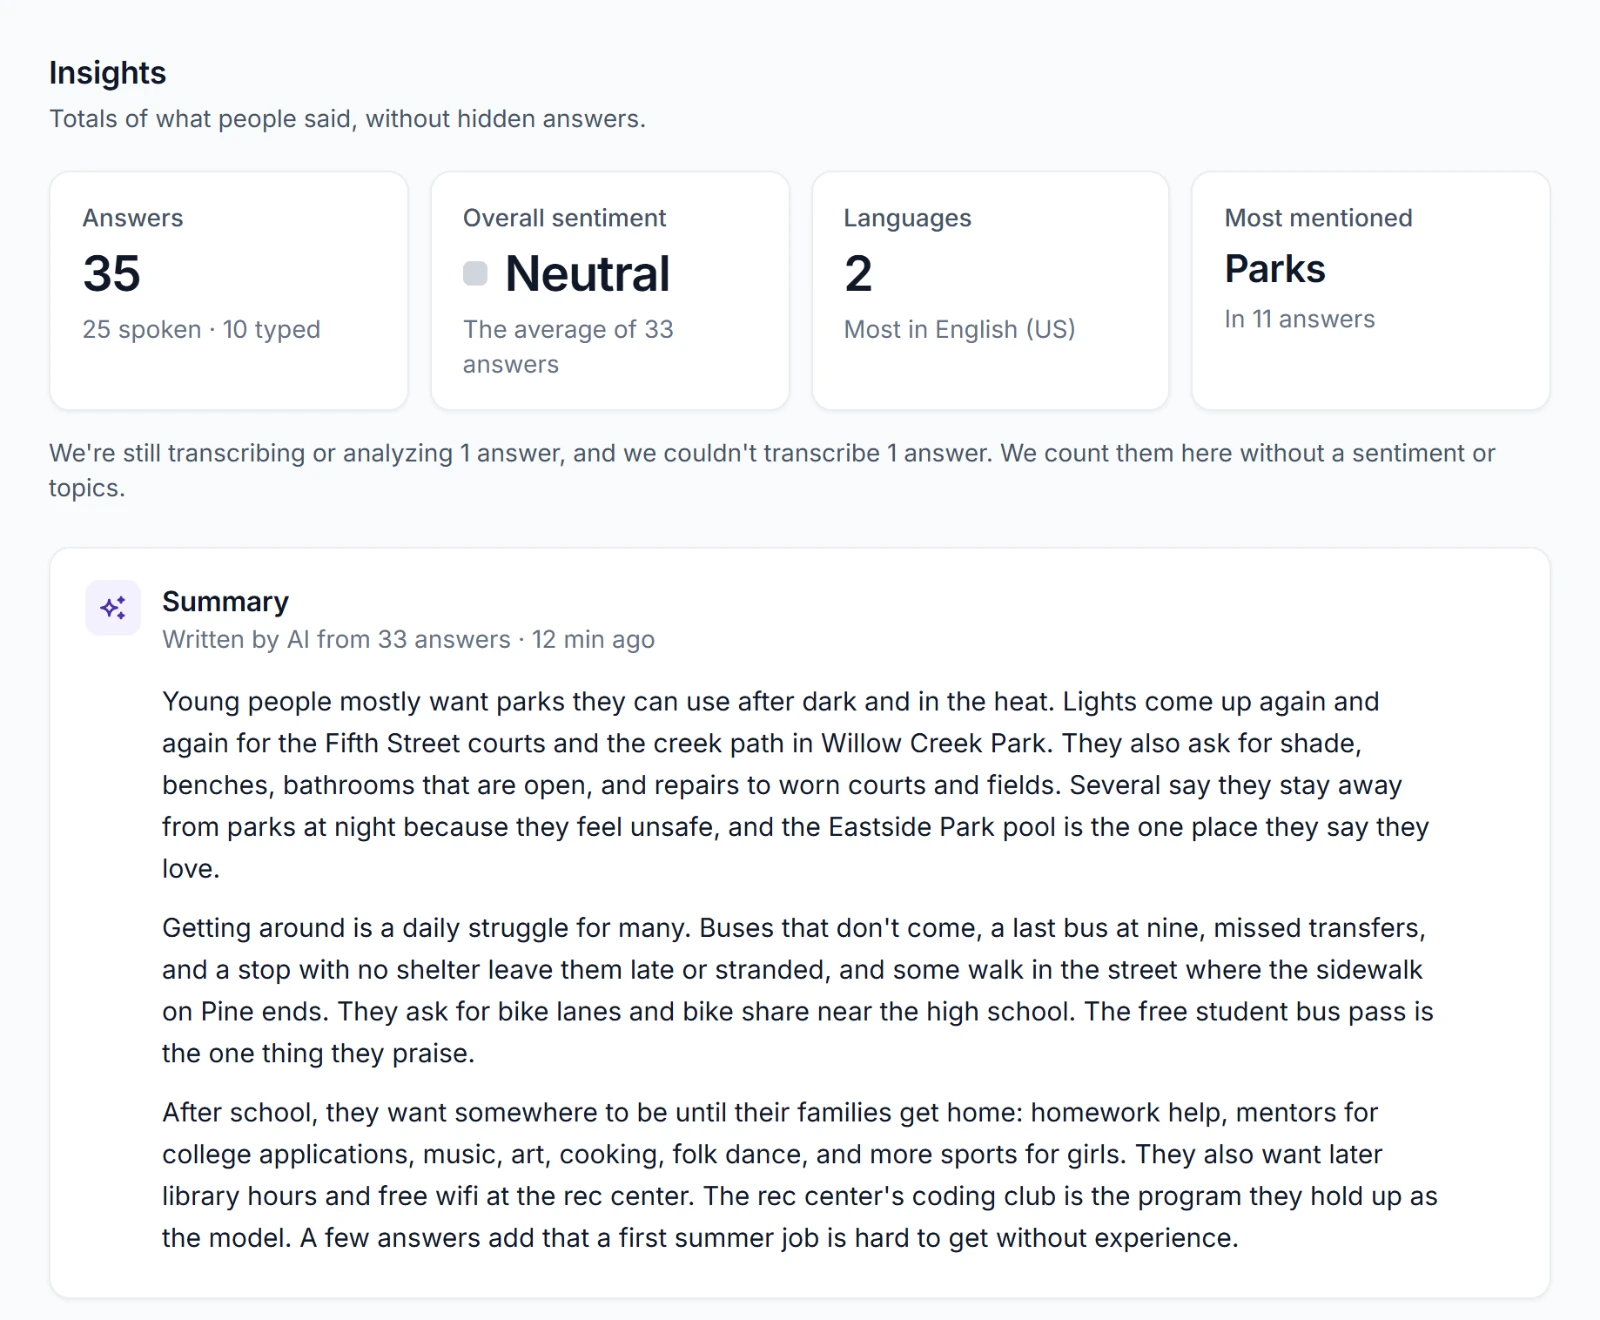
| Figure | What it shows |
|---|---|
| Answers | How many answers the campaign has, spoken and typed. |
| Overall sentiment | The average of every answer with a sentiment, rounded to the nearest of the five. |
| Languages | How many languages people answered in, and the one most of them used. |
| Most mentioned | The topic the most answers mention, and in how many. |
Answers we're still working on, and those we couldn't transcribe, count in Answers without a sentiment or topics. A note under the figures says how many there are.
The summary
Summary is written by AI from the campaign's 200 newest answers that have words. It reads each one whole and in English where the answer has a translation. The summary itself is in English. Its note says how many answers it read and when it was written.
It leads with what several answers share and says how many make each point. It runs in proportion to what was said, so a campaign of a few short answers gets a few sentences.
It keeps up by itself. We write it again within a few minutes of an answer arriving, being hidden, or being deleted. On a busy campaign, we write it at most every 15 minutes. Until the next one, it says Newer answers will be in it within 15 minutes.
On a campaign of more than 200 answers, the summary reads the newest 200, so read it as the current shape of what people say. The figures and charts count every answer.
A campaign whose Analysis doesn't include Summarize has no summary. See Analysis.
The charts
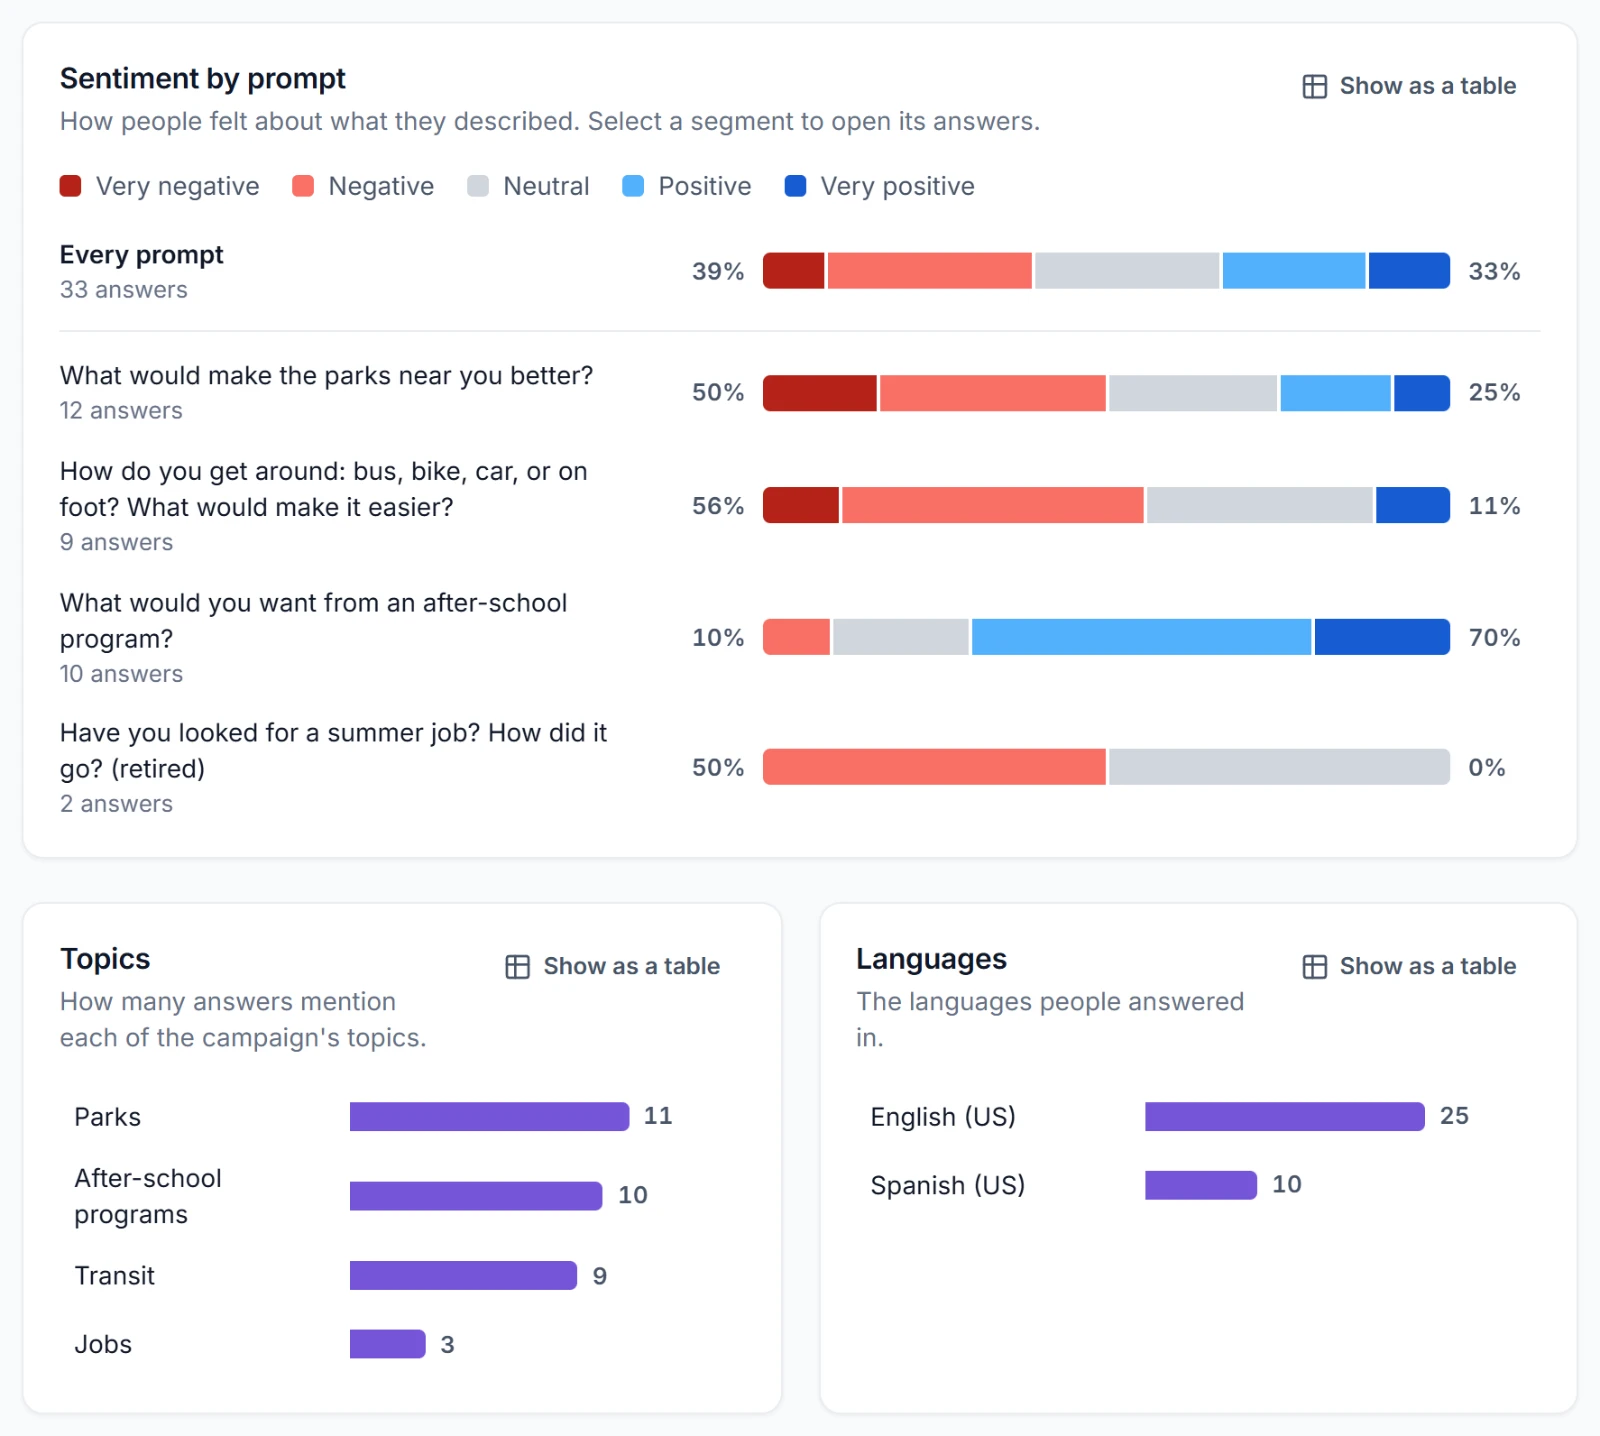
| Chart | What it shows |
|---|---|
| Sentiment by prompt | How people felt about every prompt together and about each one. Negative answers are on the left and positive ones on the right, and each bar's negative and positive shares are written at its ends. |
| Topics | How many answers mention each of the campaign's topics. |
| Languages | How many answers came in each language. It shows when the campaign offers more than one. |
| Answers over time | The running total of answers by day in your organization's time zone. A campaign that runs past three months shows it by week. |
- Select a bar or a segment to open Answers filtered to the answers it counts. See Finding answers.
- Point at a bar or a segment to see its count.
- Show as a table shows a chart's numbers as a table, and Show the chart goes back.
A chart with nothing to show says why, such as a campaign with no topics listed or one whose Analysis doesn't include Sentiment.
The time zone is your organization's, set in Settings. See Settings.