Adding Data
How to put data on a map: your organization's Salesforce records, kept in step live or as a copy, addresses placed as pins, files you upload, Census boundaries and CDC health measures, and places you find.
Overview
A layer's data comes from one of four places:
| Source | How you add it | Kept up to date |
|---|---|---|
| Your organization's records, from its Salesforce | Add data | Live, or as a copy updated every hour or every morning |
| A file you upload, a spreadsheet of points or a GeoJSON file of regions | The upload icons in Regions & Points | Never changes on its own |
| Public data: US Census boundaries, with CDC health measures joined on | Add boundaries for this area | Never changes on its own |
| Places you find with the search bar | Add to layer on a place | Never changes on its own |
You add data if you can edit the map. Everything here starts in Regions & Points, which opens from the top icon on the map's right side.
Your organization's records
Add data, at the top of Regions & Points, maps records from your organization's Salesforce: Accounts, Contacts, cases, or any other object its connection can read. An admin turns the organization's Salesforce on for Mosaic first. See Sources.
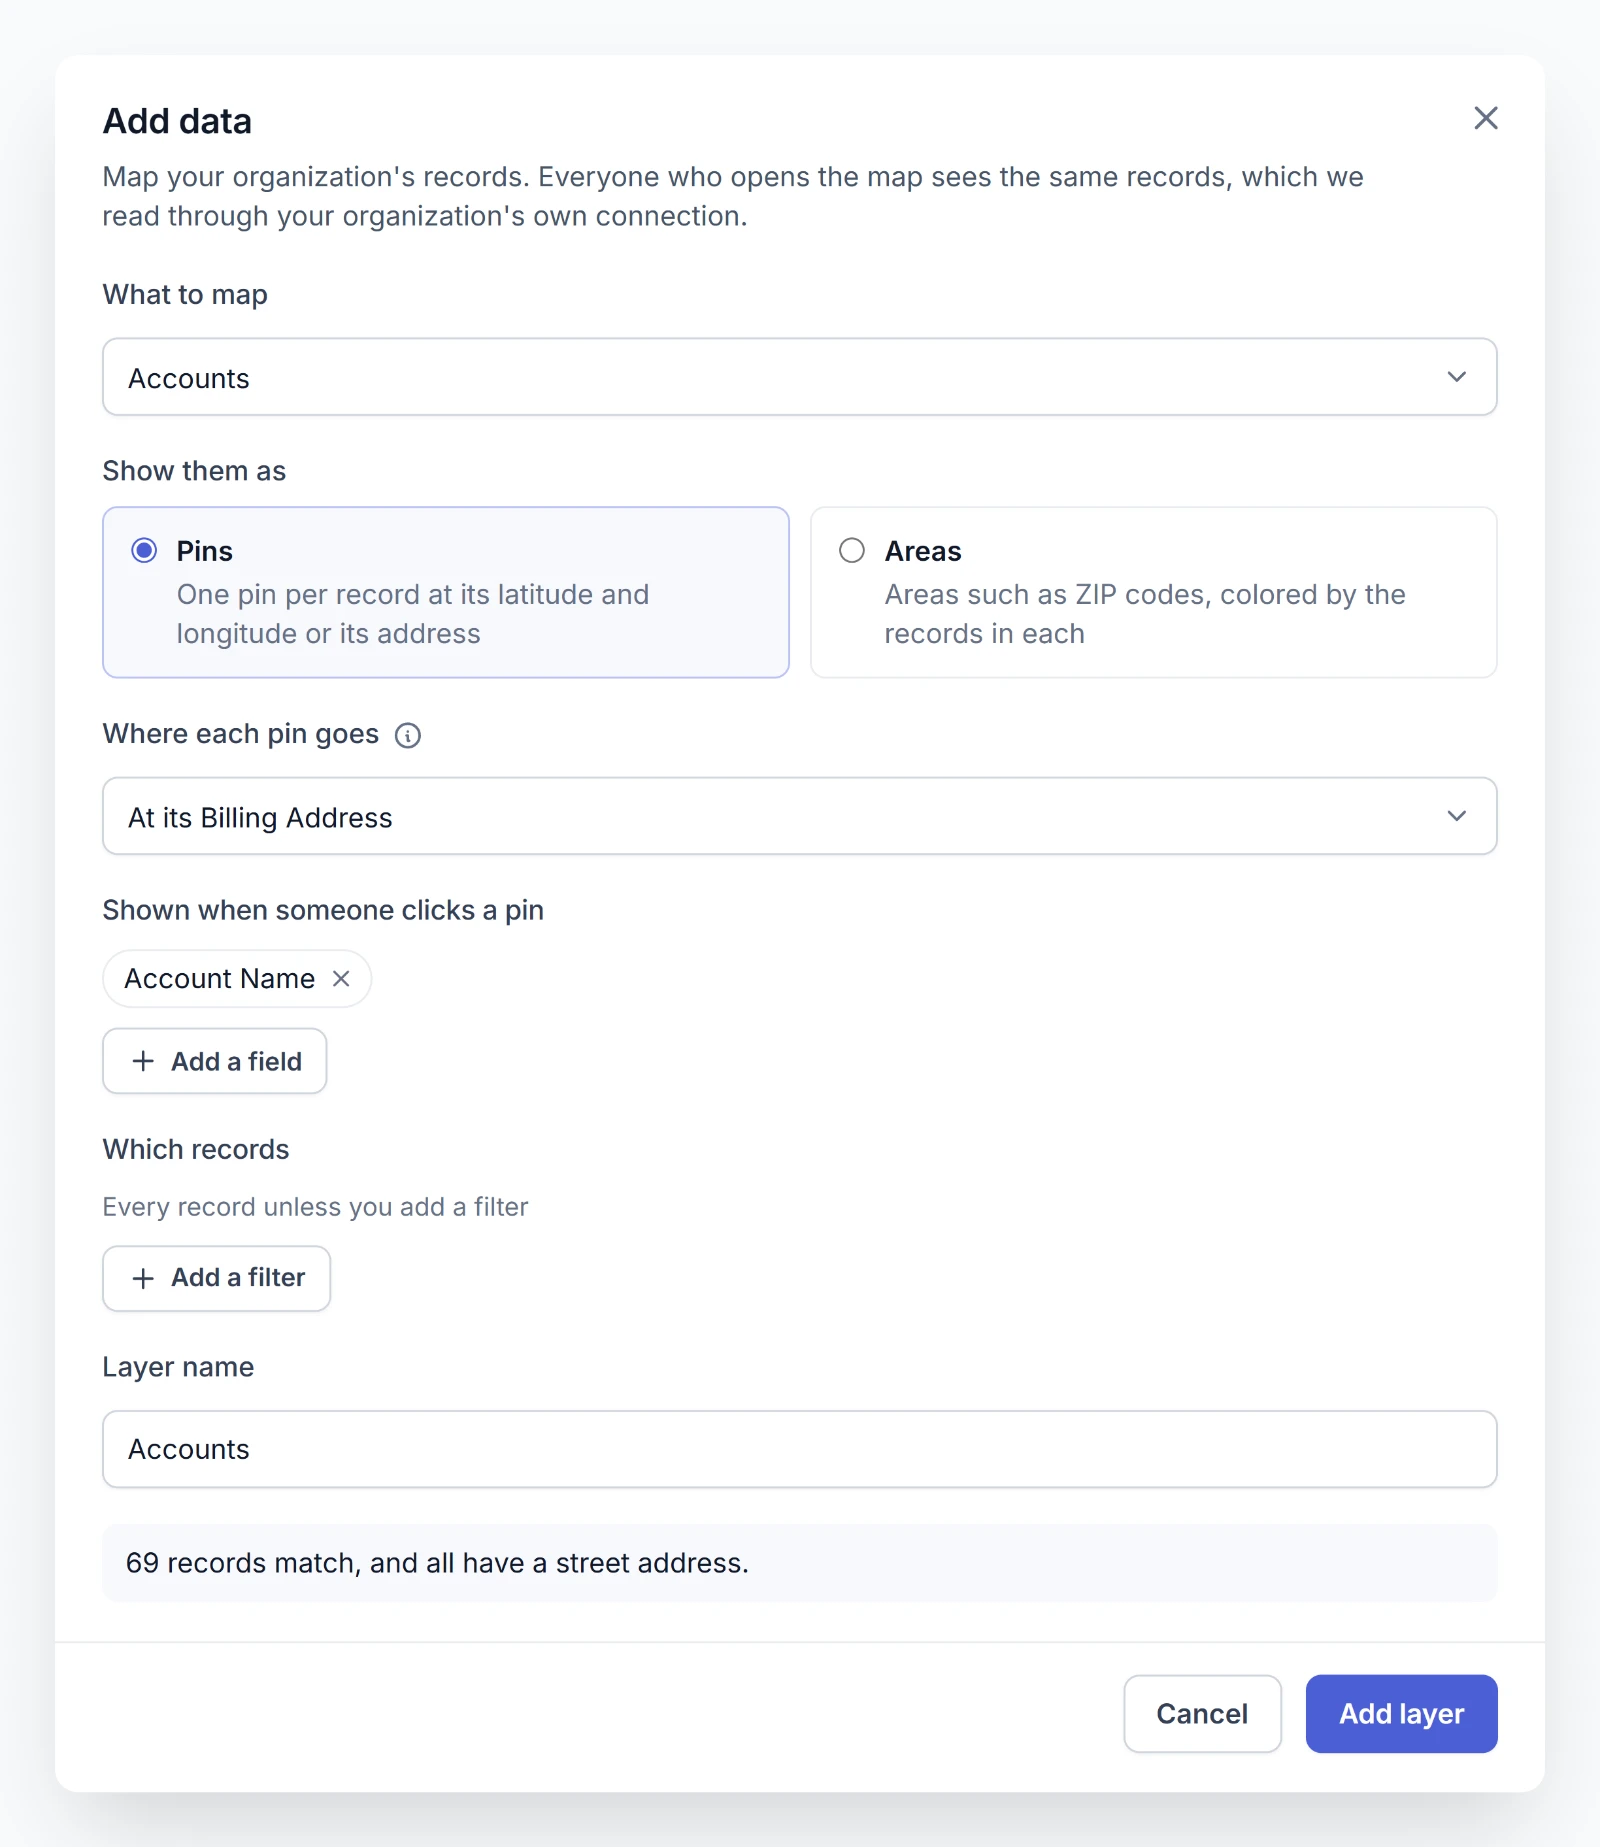
- Choose What to map, such as Accounts. If more than one source is on, choose the Source first.
- Under Show them as, choose Pins for one pin per record, or Areas for areas such as ZIP codes, colored by the records in each.
- Say where each record goes, below.
- For pins, choose the fields Shown when someone clicks a pin with Add a field, up to 20.
- Under Which records, add filters if you want only some of them, below.
- Check the Layer name and choose Add layer.
As you choose, a line at the bottom counts how many records match and how many can go on the map.
The layer goes on the map at once, saved, and its records follow a moment later. Mosaic says Reading with the layer's name above the map while they're on their way.
Where each pin goes
Where each pin goes offers what the object has:
- At its latitude and longitude: choose a Latitude field and a Longitude field.
- At its Billing Address and the like: one for each address field the object has.
- At its street, city, state, and ZIP code: choose a field for each. Only Street is required.
A record placed by its address becomes a pin once Mosaic finds the address. See Addresses become pins.
Areas
For Areas, choose the Field naming each record's area, such as a ZIP code field, and the Kind of area it names, such as ZIP codes, Counties (FIPS codes), or Census tracts. Mosaic draws the Census's outline for each area named.
Color each area by sets each area's value: Number of records, or the Total, Average, Lowest, or Highest of a Number field.
Choosing which records
Every record shows unless you add a filter.
- Choose Add a filter and pick a field.
- Choose a condition, such as is, contains, or is at least, and a value.
- Choose Done.
With two filters or more, records have to match all of them. To combine them another way, switch on Combine the filters my own way and write the Filter logic, such as 1 AND (2 OR 3). The numbers refer to the filters above.
What everyone sees
Everyone who opens the map sees the same records, including anyone with its link. Mosaic reads them through your organization's connection, not as the person looking. Points show only the fields you chose. See What a layer sees.
A layer holds up to 25,000 points. A layer of areas shows the 1,200 areas with the most records. Past either limit, add a filter.
Above the map, people who can edit it see what a layer left out and why, such as records with no street address or areas the Census doesn't have. Anyone who opens the map is told when a layer couldn't be read.
Changing a layer of records
Choose Edit data from the layer's menu. The same dialog opens on what the layer reads. Change what you need and choose Save. Its source and whether it shows pins or areas stay as they were.
Addresses become pins
Records and spreadsheet rows placed by their address become pins as Mosaic finds them.
- Pins fill in as they're found. The layer shows what's placed at once, and Mosaic says how many addresses it's still placing. New addresses can take a few minutes.
- Only a street makes a pin. A record with no street address isn't on the map. People who can edit the map are told how many.
- Each address is looked up once. One Mosaic can't find isn't looked up again. One it couldn't look up just then is tried again within the hour.
Each new address counts toward your organization's monthly address lookups, 50,000 a month unless Flourish raises it. Other Flourish apps that place addresses count toward the same allowance. Admins see the month's count in Settings. Once it's used up, a layer of records places its new addresses on the first of the next month, and an upload leaves them out. See Address lookups.
Live or a copy
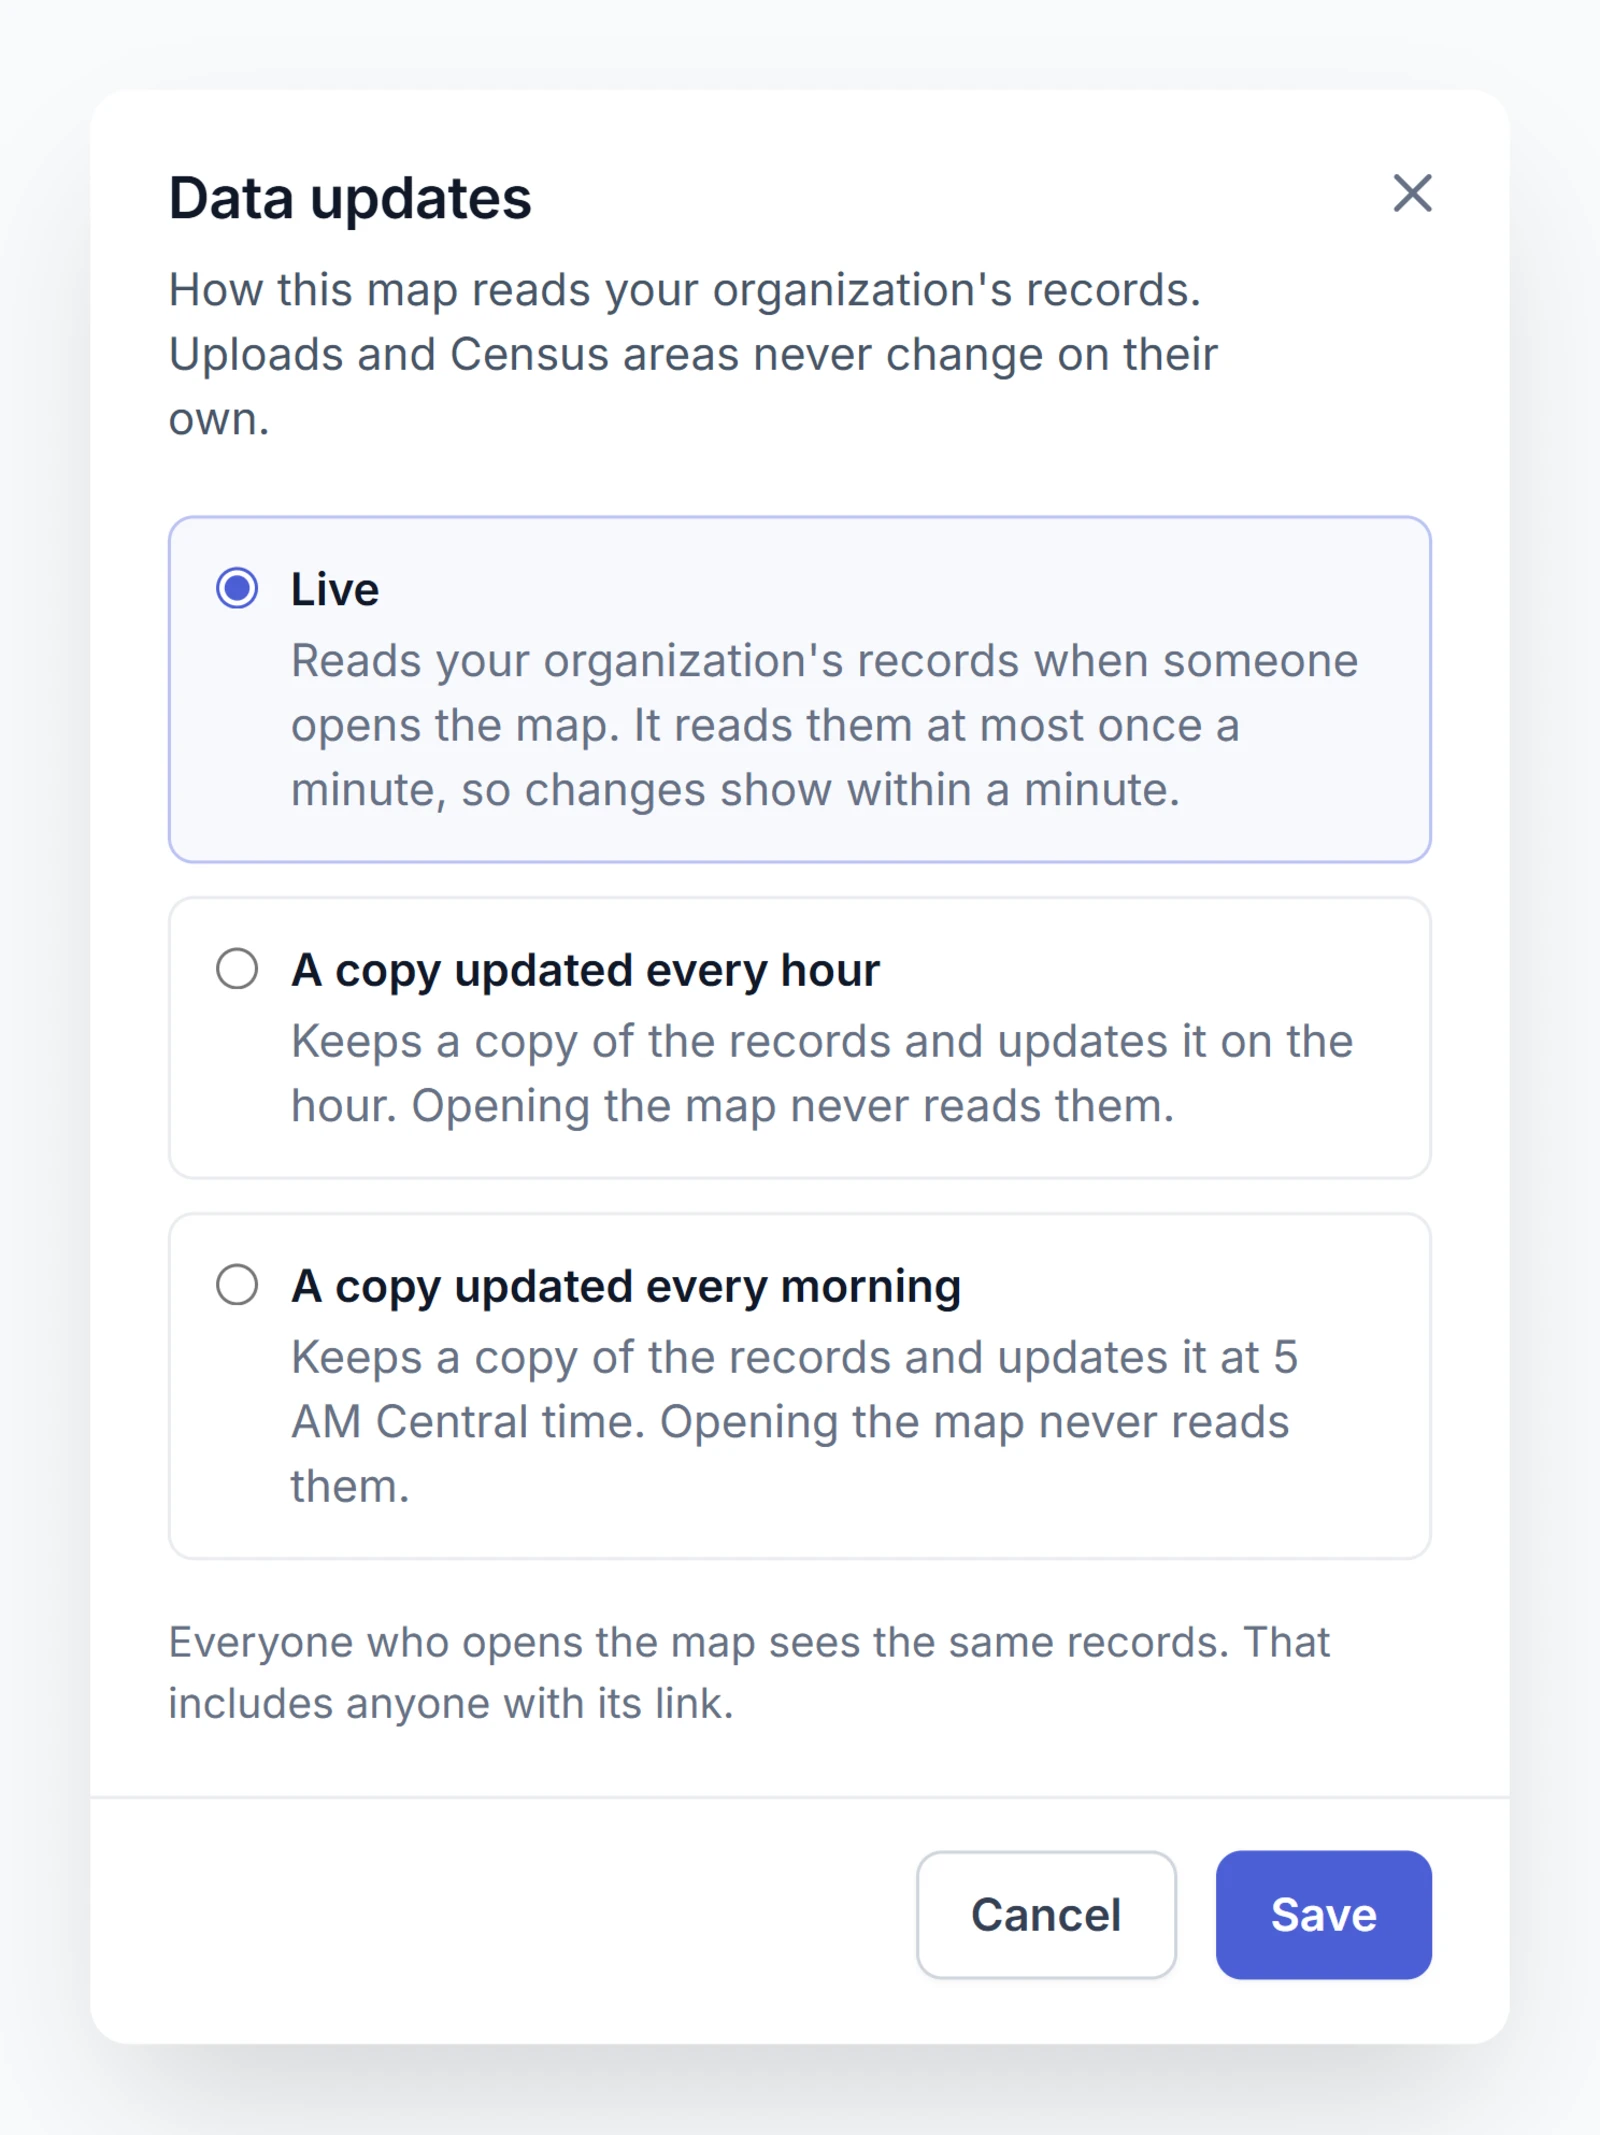
A map with a layer of records reads them in one of three ways. Choose Data updates from the … menu at the top of the map's page.
| Choice | What it does |
|---|---|
| Live | Reads the records when someone opens the map, at most once a minute, so changes show within a minute. Every map starts live. |
| A copy updated every hour | Keeps a copy of the records and updates it on the hour. Opening the map never reads them. |
| A copy updated every morning | Keeps a copy and updates it at 5 AM in your organization's time zone. See Organization settings. |
Choosing a copy reads the records right then, so the copy starts from that moment. Above a map that shows a copy, everyone sees when it was read and how often it's updated. People who can edit the map have Update now there to read it again at once.
However many people visit a live map's link, it reads your organization's data at most once a minute. Share says so.
Uploading points
Choose Upload points, the upload icon next to Points in Regions & Points.
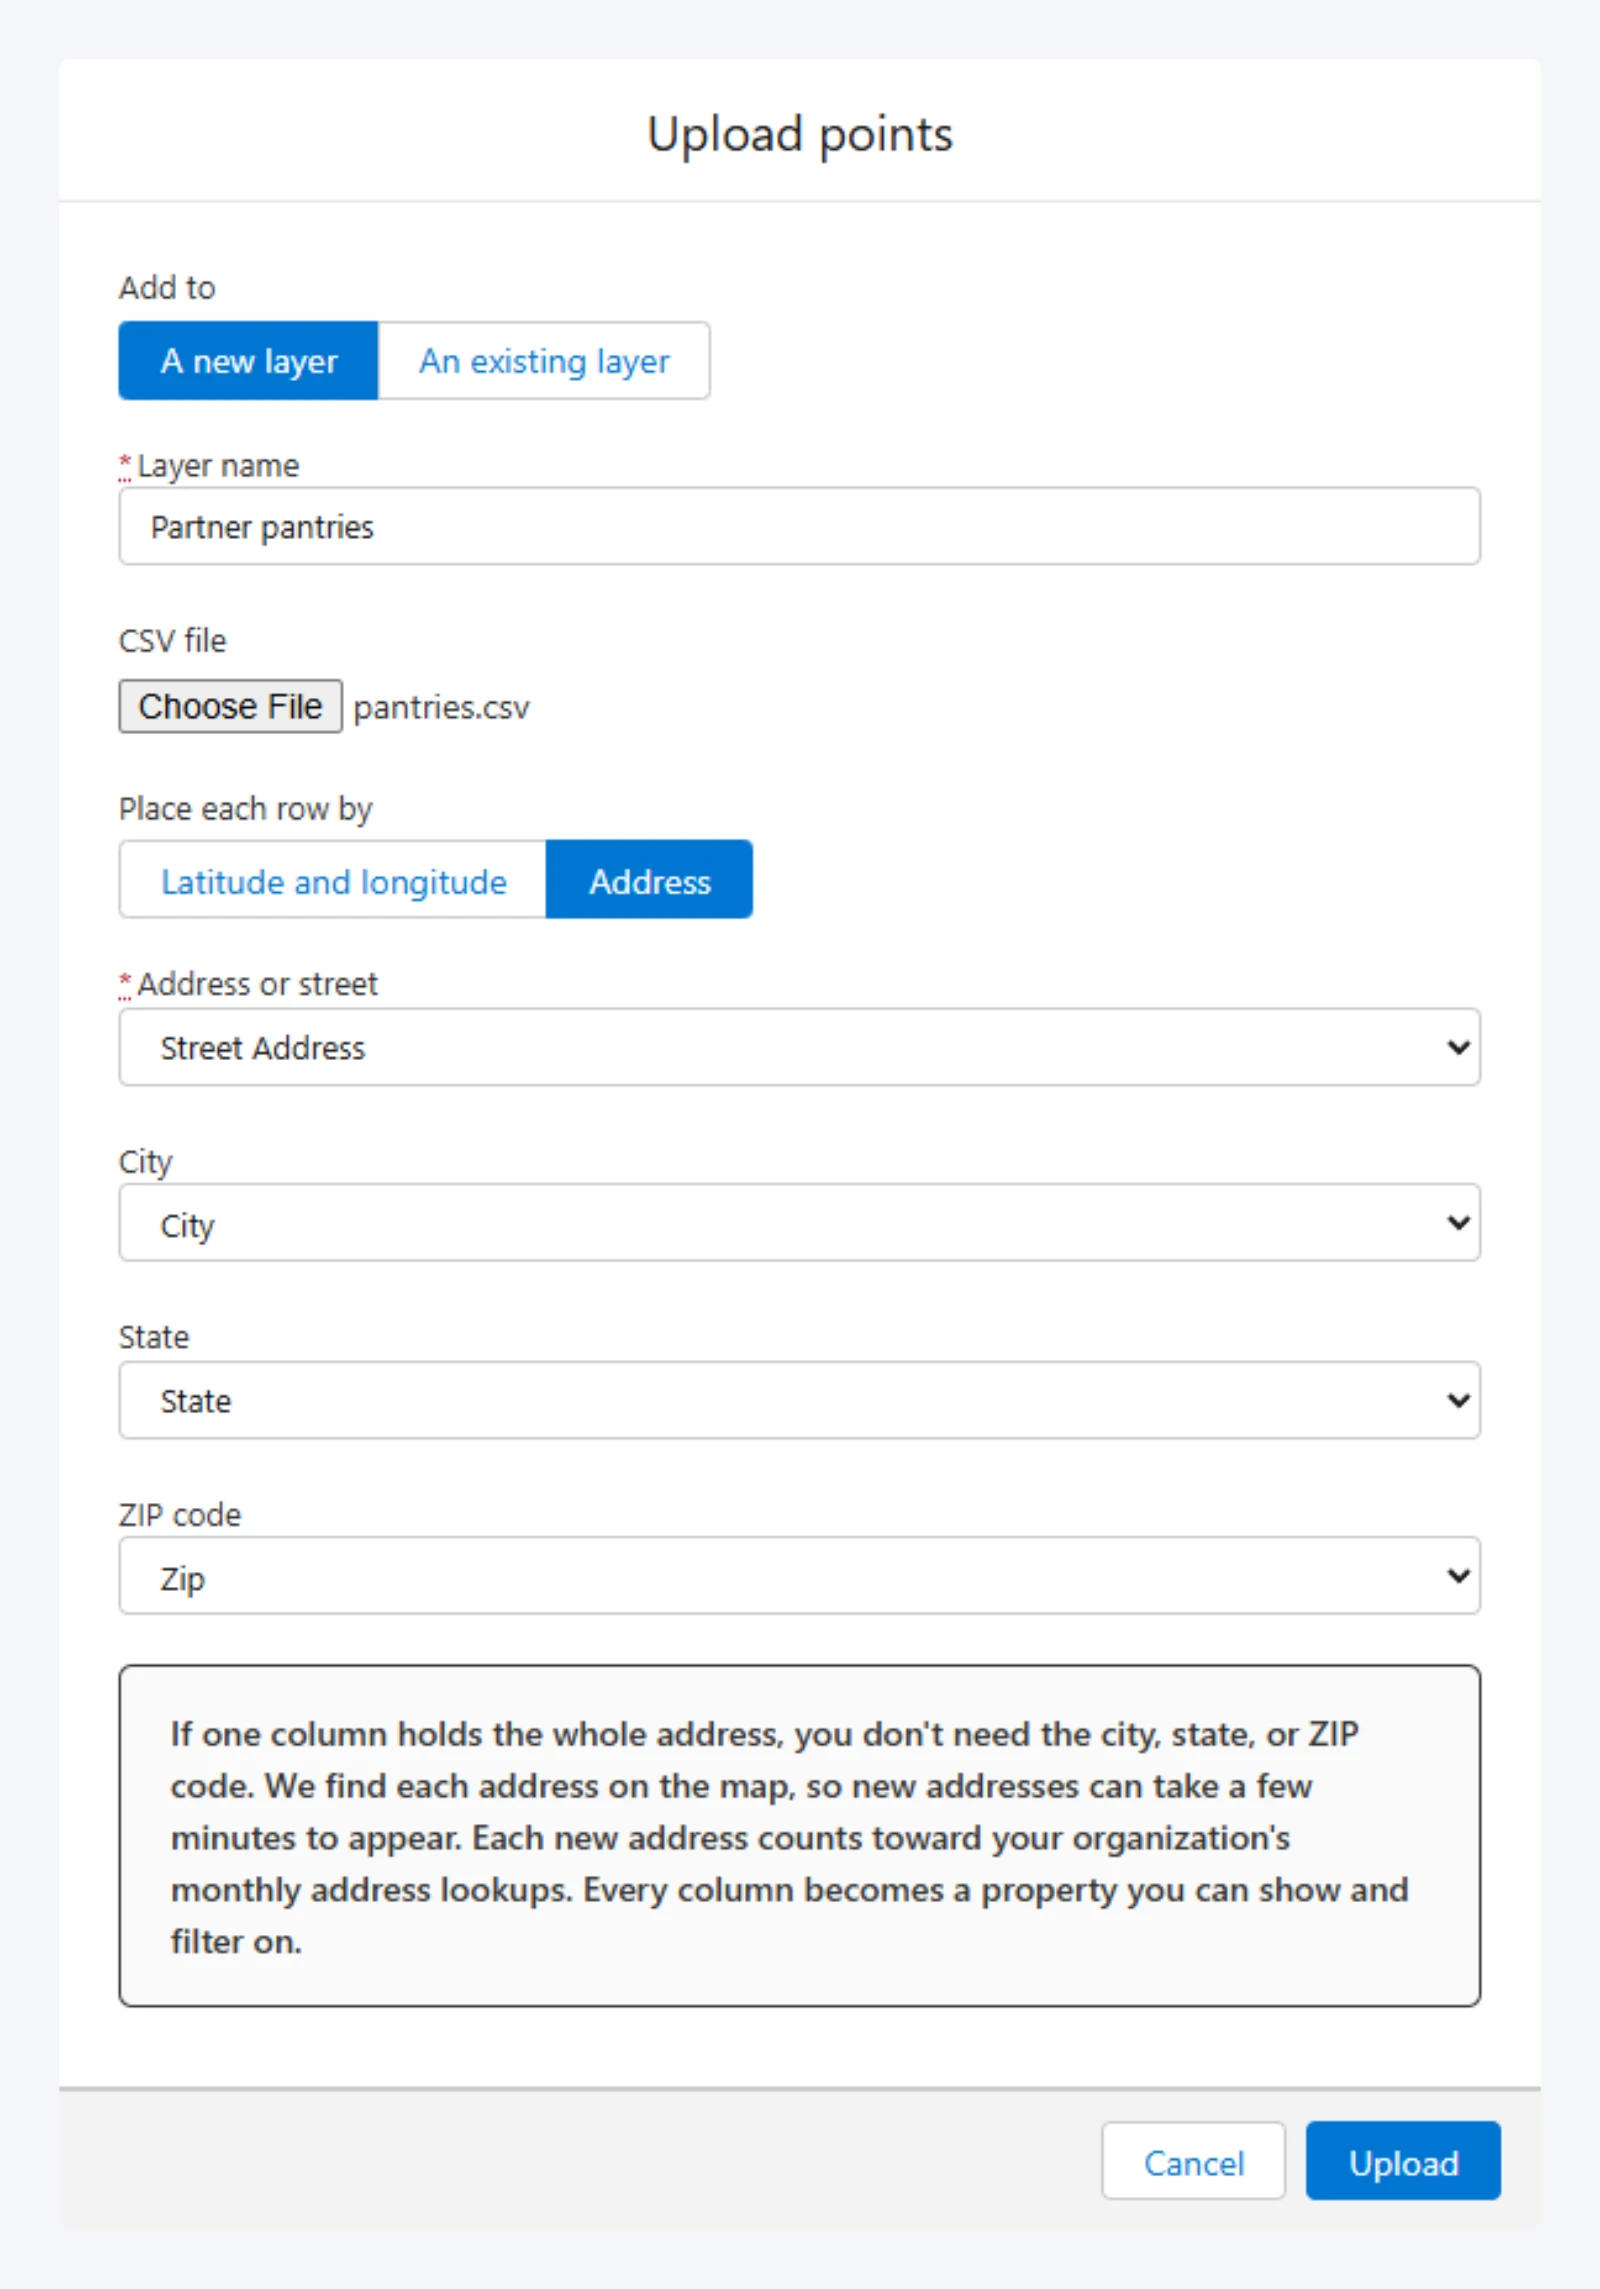
- Under Add to, choose A new layer and give it a Layer name, or choose An existing layer of the map's.
- Choose a CSV file.
- Under Place each row by, choose how each row finds its place:
- Latitude and longitude: the file needs Lat and Lng columns.
- Address: choose the column under Address or street, and City, State, and ZIP code if the file keeps them apart. One column holding the whole address is enough. Mosaic fills these in from the column names, so check them.
- Choose Upload.
Every other column becomes a field you can show, filter on, and search. Mosaic says how many rows it left out and why, such as a row with no address.
Rows placed by address show Placing on the layer's row until each is found or isn't. You can save the layer once they're done. See Addresses become pins.
A file can be up to 50 MB, and up to 25,000 rows can be placed by address at a time.
Uploading regions
Choose Upload regions, the upload icon next to Regions.
- Under Add to, choose A new layer and give it a Layer name, or choose An existing layer.
- Choose a GeoJSON file,
.geojsonor.json, up to 50 MB. - Choose the Region ID property that names each region.
- If you like, set a Region ID label, such as "ZIP code," and choose a property to Color by.
- Choose Upload.
What the file needs, and how to color each region from the file itself, is on GeoJSON.
Census boundaries and health measures
You don't need a file to map standard US areas. Add boundaries for this area, the first icon next to Regions, loads them from the US Census.
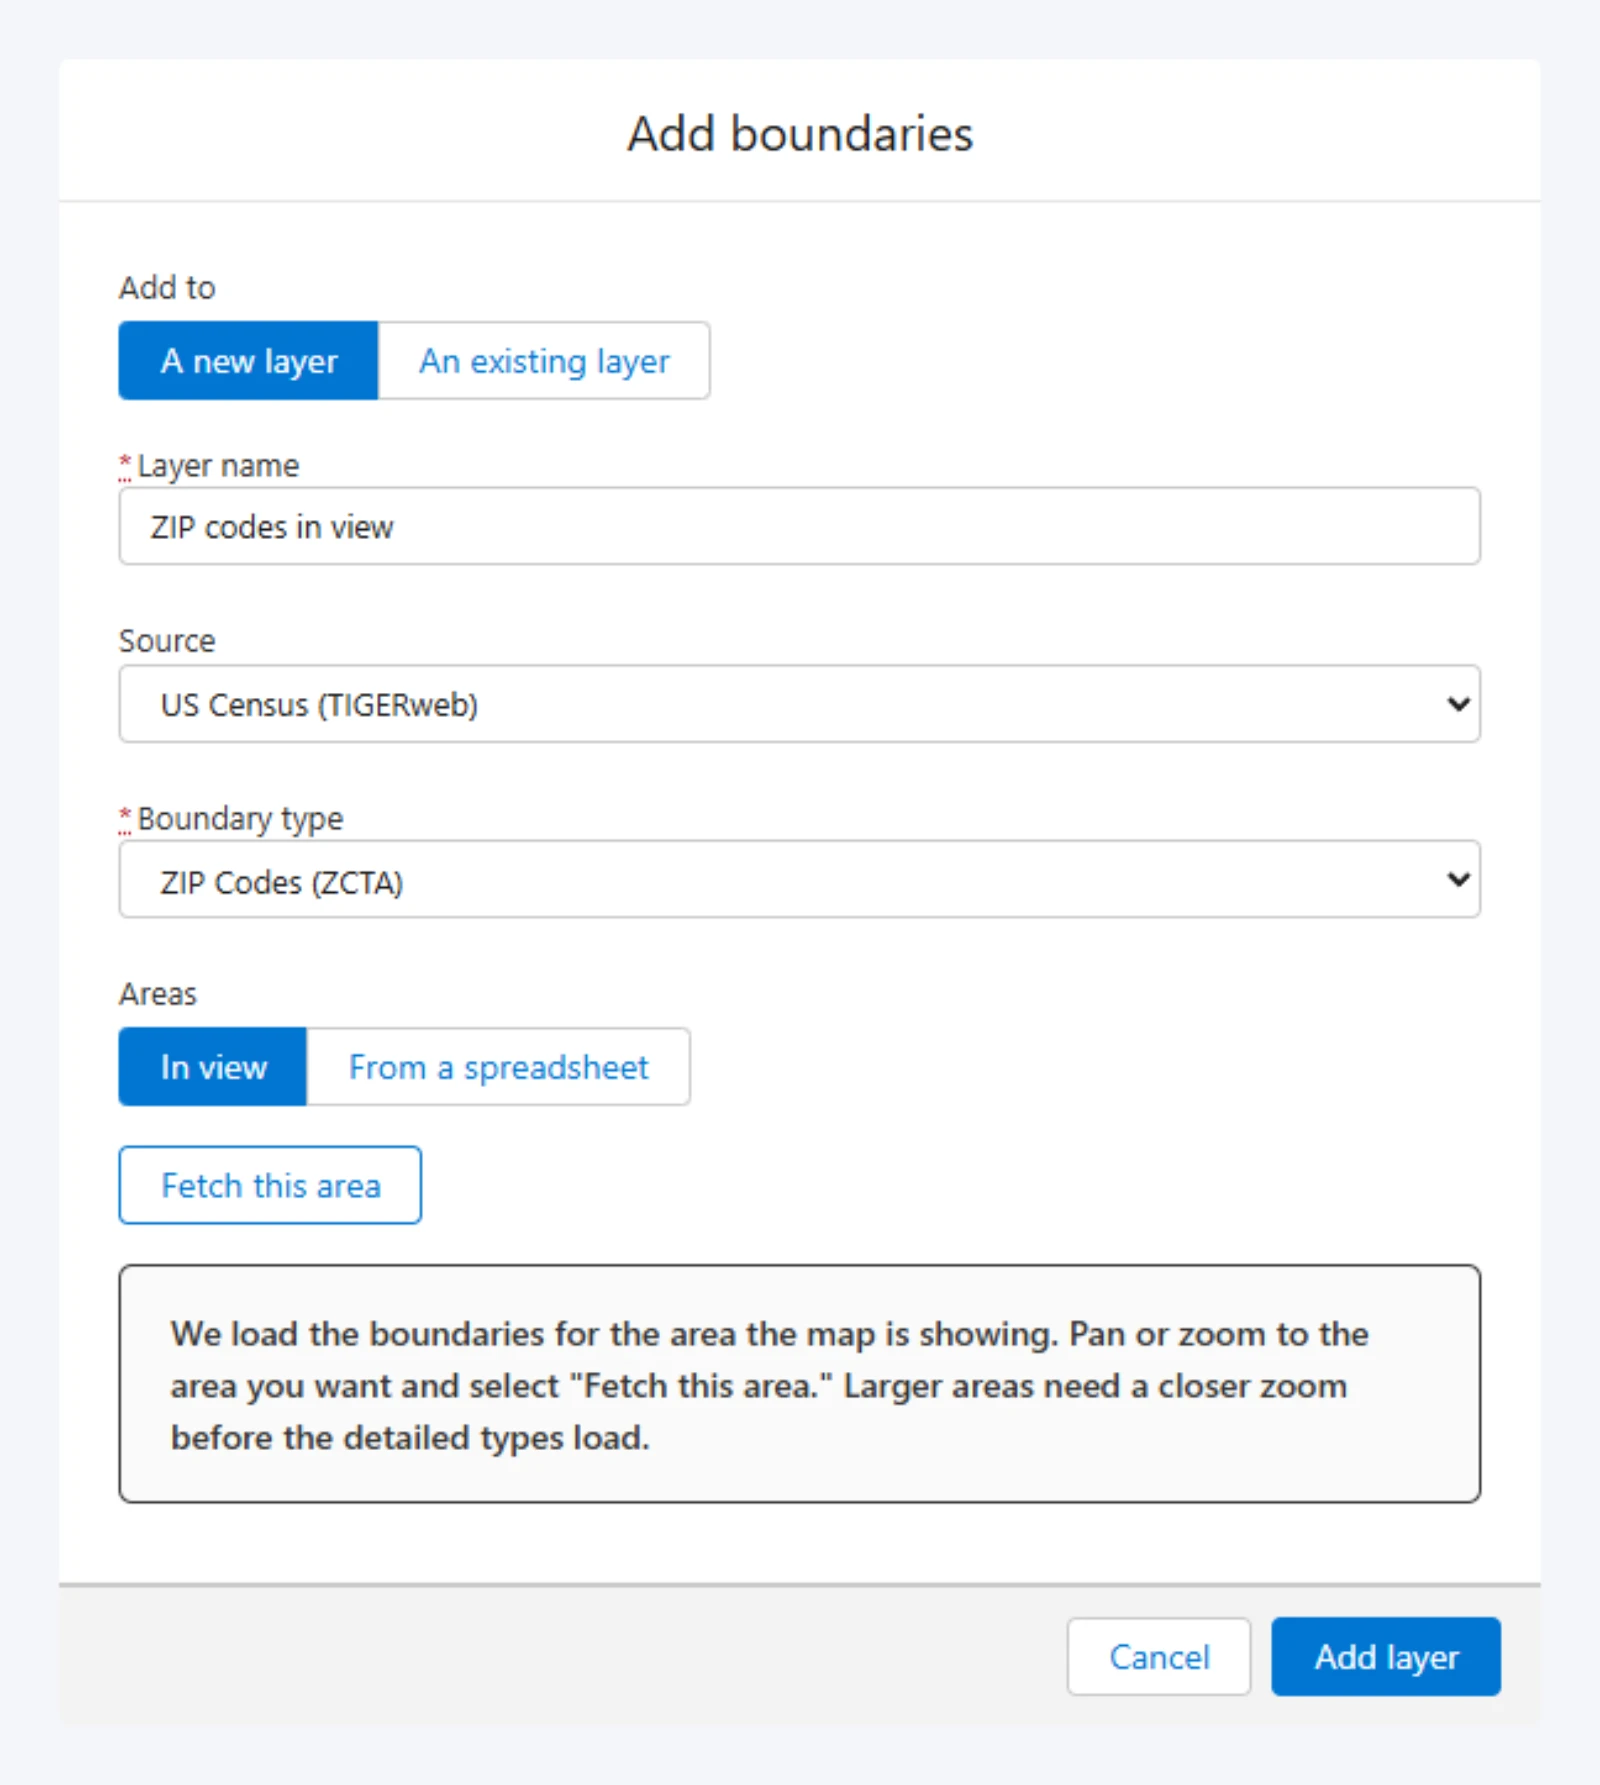
- Give the layer a Layer name.
- Choose a Boundary type.
- Under Areas, choose where the boundaries come from, below, and fetch them.
- If you like, add health measures, below.
- Check the Region ID property, choose a property to Color by, and choose Add layer.
The boundary types are States, Counties, County Subdivisions, Incorporated Places, Census Designated Places, ZIP Codes (ZCTA), Census Tracts, Block Groups, Public Use Microdata Areas, Congressional Districts, State Legislative Districts (Upper), State Legislative Districts (Lower), Unified School Districts, Metropolitan Statistical Areas, Urban Areas, and Federal American Indian Reservations. They cover the United States only.
The areas in view
In view loads the boundaries for the area the map is showing. Pan and zoom to it, then choose Fetch this area. Mosaic says how many it loaded.
Each type needs a close enough view. Zoomed out too far for census tracts, the map would hold more of them than one fetch can carry, so Mosaic asks you to zoom in. States load at any zoom, and the finer the boundary, the closer you need to be.
The areas a spreadsheet names
From a spreadsheet loads exactly the areas a CSV names, wherever they are, and puts the spreadsheet's other columns on them.
- Choose the Spreadsheet (CSV).
- Choose the column holding each row's area by its Census code, such as a ZIP code like
77002, a county's FIPS code like48201, or a tract's 11 digits. - Choose Fetch these areas.
Codes match even when a spreadsheet dropped their leading zeros or added a ZIP+4. Names don't match. Amounts such as $1,250 or 12% count as numbers. Mosaic says which codes matched nothing. A spreadsheet can name up to 1,200 areas.
Health measures from the CDC
Once boundaries are fetched, Add data joins published health figures onto them. Its source is CDC PLACES (local health estimates). It's offered for counties, incorporated and Census designated places, ZIP codes, and census tracts.
Choose any of its 40 Measures, such as diabetes, no health insurance, or annual checkups, and choose Add data. Each is a percentage of adults and becomes a property of every region, to color by, filter on, and read in Region values.
The figures are model-based estimates rather than counts, so use them to compare places rather than to report a number. A measure can come back empty across a whole area while others are complete. That's a gap in what the CDC publishes, and Mosaic says so.
Adding places you find
A place you find with the search bar can become a point on one of the map's layers. See Finding places.
- Choose the place's pin to open Place details.
- Choose Add to layer and pick a Point layer.
- Choose Add.
The place becomes a point with its name, address, and categories. If the layer is saved to the map, the point is saved at once. A layer of your organization's records doesn't take places.