Exploring Maps
How to read a Mosaic map: its layers, legend, and filters, a point's details, searching it and finding places nearby, bookmarks, and playing back how its data changes over time.
Overview
A map opens on its own page. At the top are its name, its description, who owns it, and when it last changed. Share (or Who has it), Save view for anyone who can edit the map, and the … menu sit at the top right. Below them is the map.
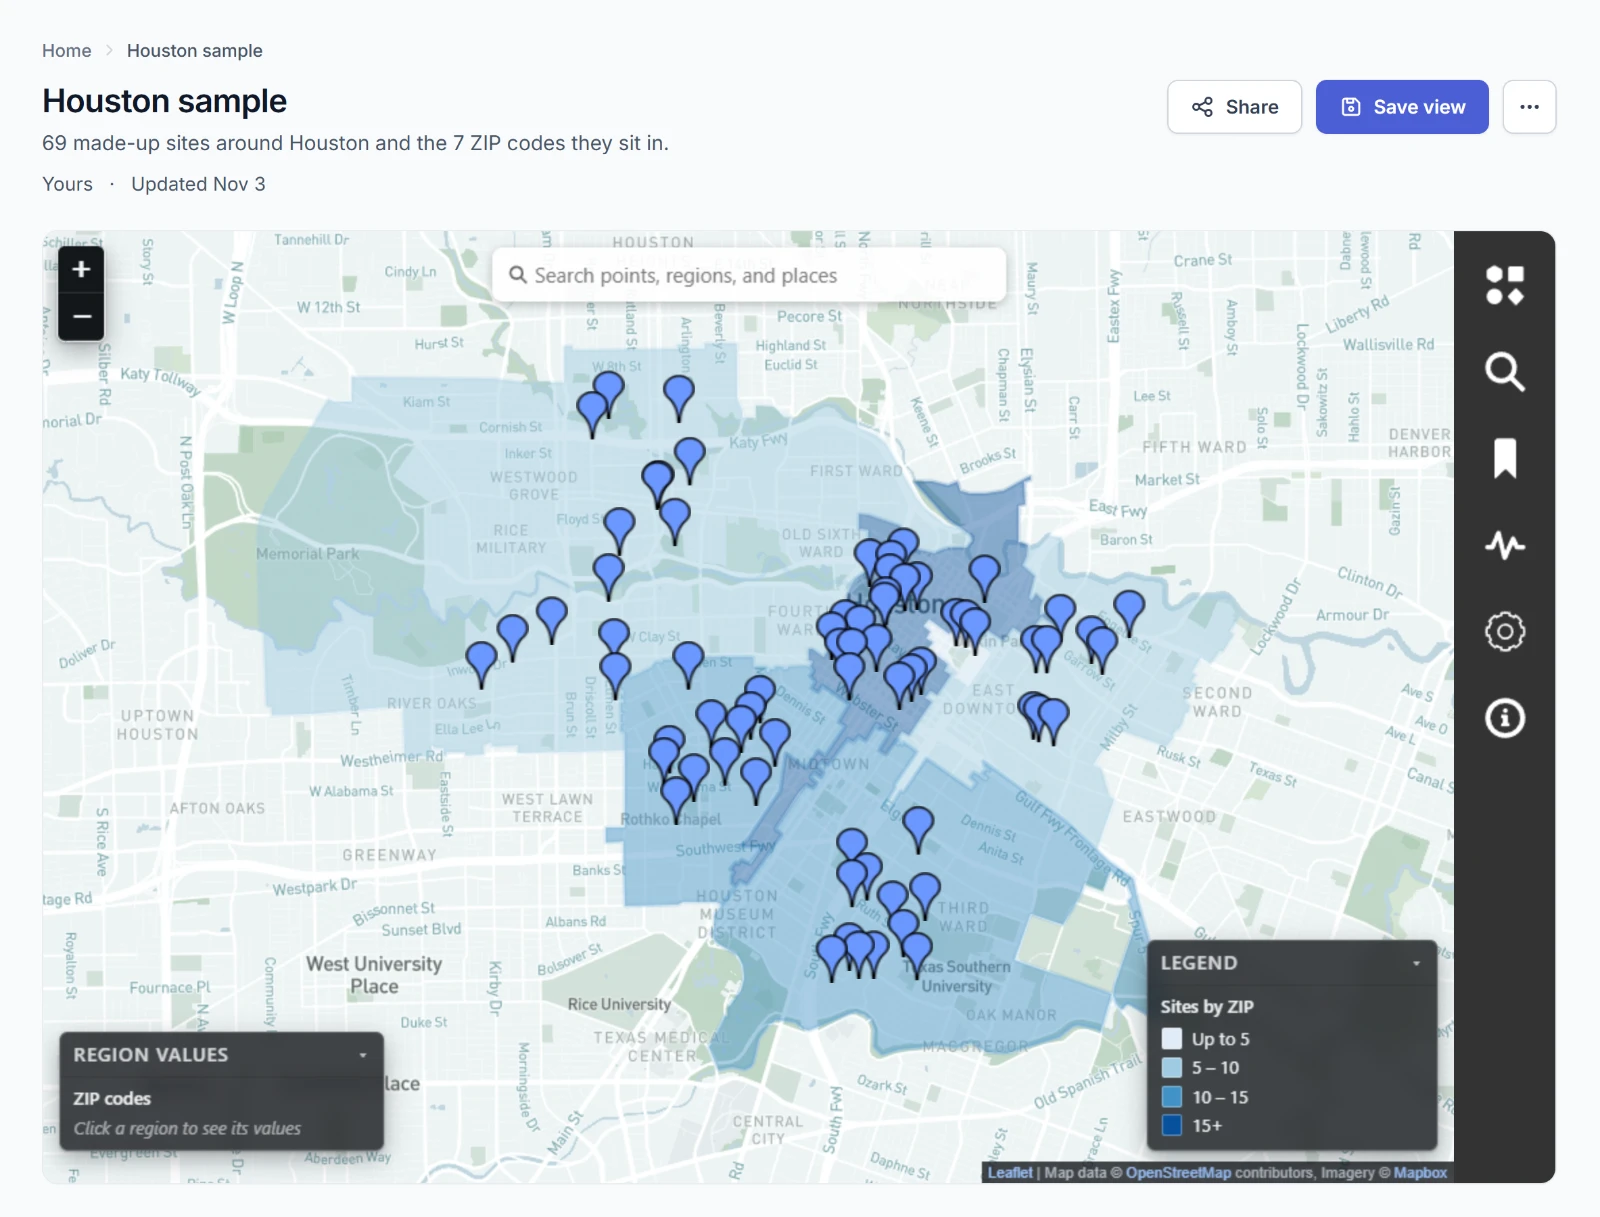
Drag the map to move it, and zoom with the buttons at the top left or your mouse wheel. The six icons down the right side open the map's panels:
| Panel | What it's for |
|---|---|
| Regions & Points | The map's layers: showing and hiding them, their colors, and filters. Map makers add and save layers here, too. |
| Search | Searching the map's points and regions, and the places you've pinned. |
| Bookmarks | Sets of points and regions you collect. |
| Time Series | Charting a layer over time and playing it back on the map. |
| Settings | Light or dark, and full screen. |
| Info | The map's name, its organization, and its description. |
Choose an icon to open its panel, and the × to close it.
Anything you do on a map that changes nothing for others is yours alone. Showing and hiding layers, filtering, searching, and building a time series work for everyone who can open the map, and none of it is kept when you leave. Only someone who can edit the map saves anything to it. See Making Maps.
Regions & Points
Regions & Points lists the map's layers, regions above points. A layer higher in the list draws on top.
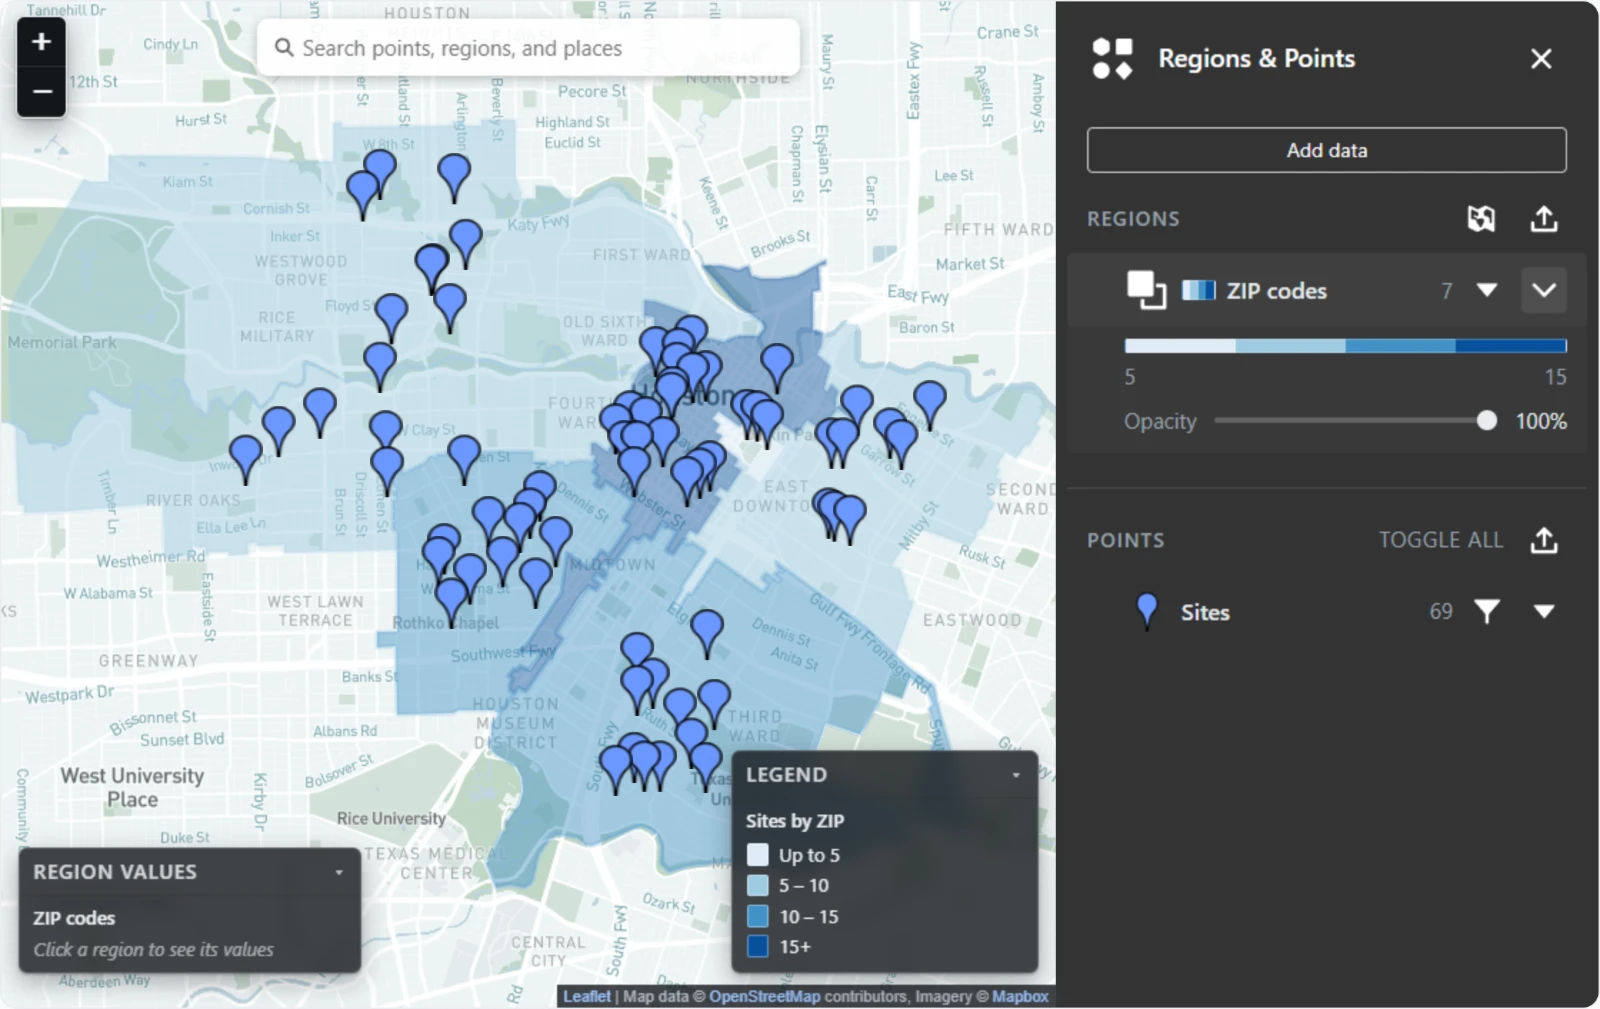
A region layer's row shows a color chip for its scale, its name, and how many regions it holds. Choose the icon at the start of the row to change how it shows: Filled, then Outline, then Hidden. The caret at the end opens the layer's color ramp, with its range at either end, and an Opacity slider that restyles the layer as you drag.
A point layer's row shows its pin, its name, and how many points it holds. Choose the pin to show or hide the layer. Toggle all shows or hides every point layer at once. The funnel opens the layer's filters.
Points close together gather into a numbered circle as you zoom out. Zoom in, or choose the circle, to see them.
The legend and region values
The Legend at the bottom right explains each region layer's colors. Its title names what's colored and by what, such as "Sites by ZIP." Choose its heading to fold it away.
Choose a region and Region values at the bottom left shows its ID, its value, and the color band it falls in. A region layer of your organization's records shows the record's other fields there, too.
Filters
Choose the funnel on a point layer's row to open its filters.
- Under Add a filter, choose a property, then an operator.
- Type a value, such as a name or a date. Is blank and Isn't blank need none.
- Choose Add filter.
| The property holds | Operators |
|---|---|
| Text | Equals, Doesn't equal, Contains, Doesn't contain, Is blank, Isn't blank |
| Numbers or dates | Equals, Doesn't equal, Greater than, Greater than or equal to, Less than, Less than or equal to, Is blank, Isn't blank |
| Anything else | Equals, Doesn't equal, Is blank, Isn't blank |
The filter is listed under Active filters. Choose it to turn it off without removing it, or choose its × to remove it.
Apply to other layers lists the map's other layers. Switch on the ones that should get the same filters and choose Apply filters.
A time series of the layer and regions filled from it follow its filters. So does the search bar once Only search visible points and regions is on.
A point's details
Point at a pin to see a few of its fields, and choose it to open Point details with all of them.
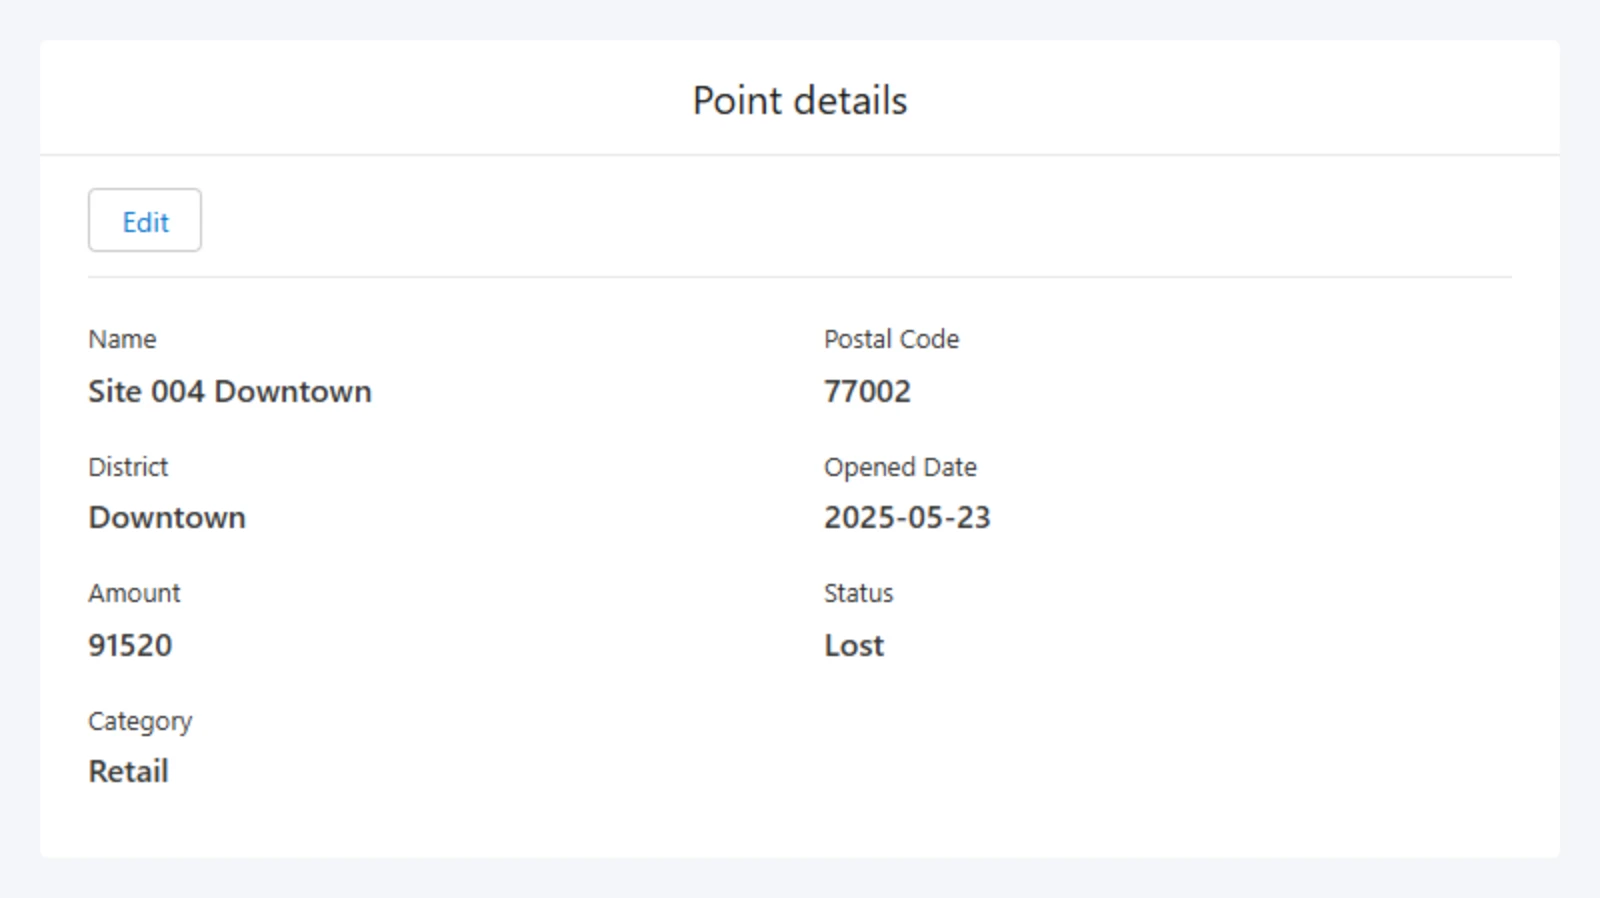
The name comes first, and labels come from the field names, so PostalCode reads Postal Code. A web address is a link that opens in a new tab, and true or false reads Yes or No.
Someone who can edit the map gets Edit on a point of a layer the map keeps, such as an upload. See Changing a point. A point from your organization's records has no Edit since the record is changed where it lives.
Search
The search bar
Type in the bar across the top of the map and press Enter. Mosaic finds the map's own points and regions by any of their fields and lists up to eight. Choose one to go to it.
Finding places
The bar also finds places near the middle of the map, such as churches, clinics, or food pantries. After you press Enter, choose Search places for "…" under the map's own matches.
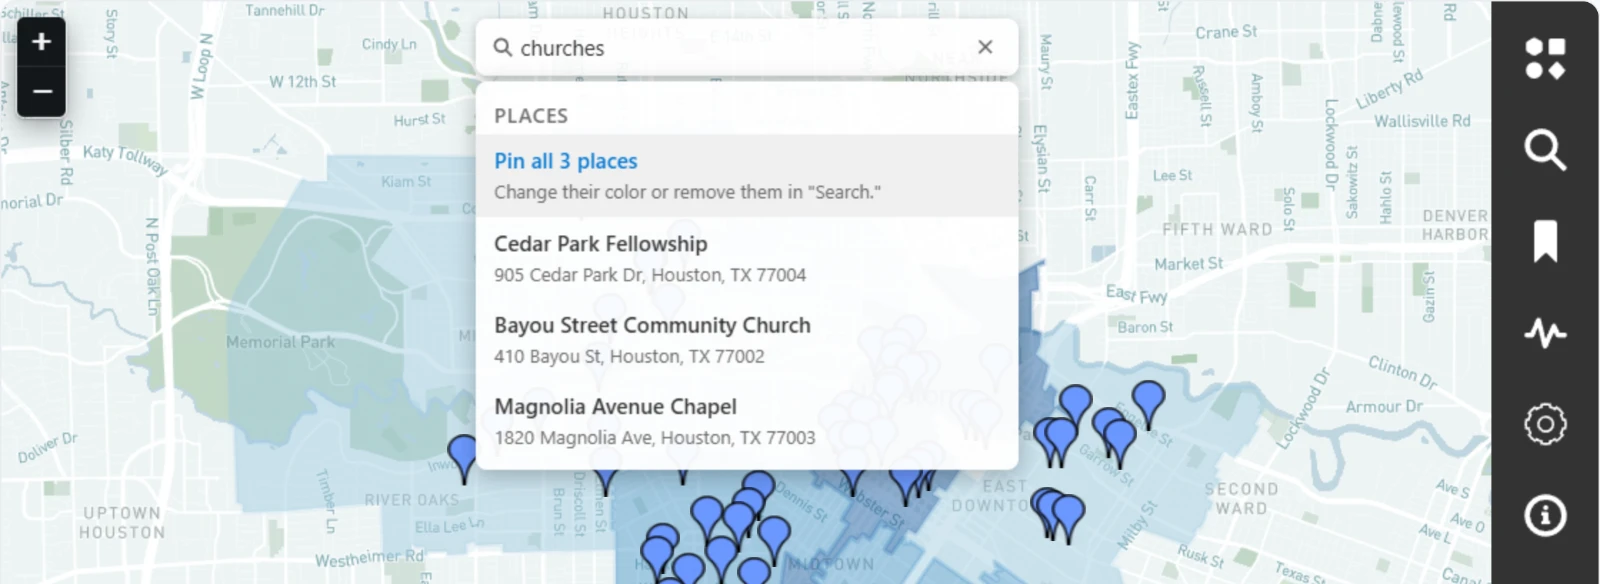
- Choose one place to pin it on the map and go to it.
- Choose Pin all to pin every place found as one layer, named for your search, and fit the map to them.
Choose a place's pin to open Place details: its name, address, and categories. Someone who can edit the map can add it to one of the map's point layers. See Adding places you find.
Pinned places are yours. They aren't saved to the map, and they're gone when you leave it. A map opened by its link offers no places.
The Search panel
| Section | What it's for |
|---|---|
| Search settings | Only search visible points and regions leaves hidden layers and filtered-out points out of the bar's results. Always include places in the search bar searches for places with every search. |
| Places of interest | The places you've pinned, one row for each search. Choose a row's pin to change its color, or its × to remove it. |
| Regions and points | A search of one layer. Choose the Layer, and a Field (optional) to search only that field, then type and press Enter. Each search is kept as a pill under Your searches. Choose a pill to see its results, and a result to go to it. |
Bookmarks
Bookmarks collect points and regions from any layer into named sets.
- In Bookmarks, type a name under Bookmark sets and choose + (Create set).
- Choose the set to open it.
- Hold B and click points or regions on the map to add them. Do the same to take one out. Or switch on Add or remove by clicking the map and click without holding B.
The open set lists what it holds by name, layer, and kind. Choose an item to go to it, or its × to take it out. Only show bookmarked items hides every other point on the map, and the search bar then finds only the set's own.
Opening another panel switches Add or remove by clicking the map off.
A saved set is there for everyone who opens the map, including anyone with its link. Someone who can edit the map saves a set with its save icon, and a set not saved yet reads Unsaved. Everyone else can make sets of their own to work with, and the panel says they aren't saved. A map holds up to 50 sets, each with a name of up to 80 characters and up to 1,000 points and regions.
Time Series
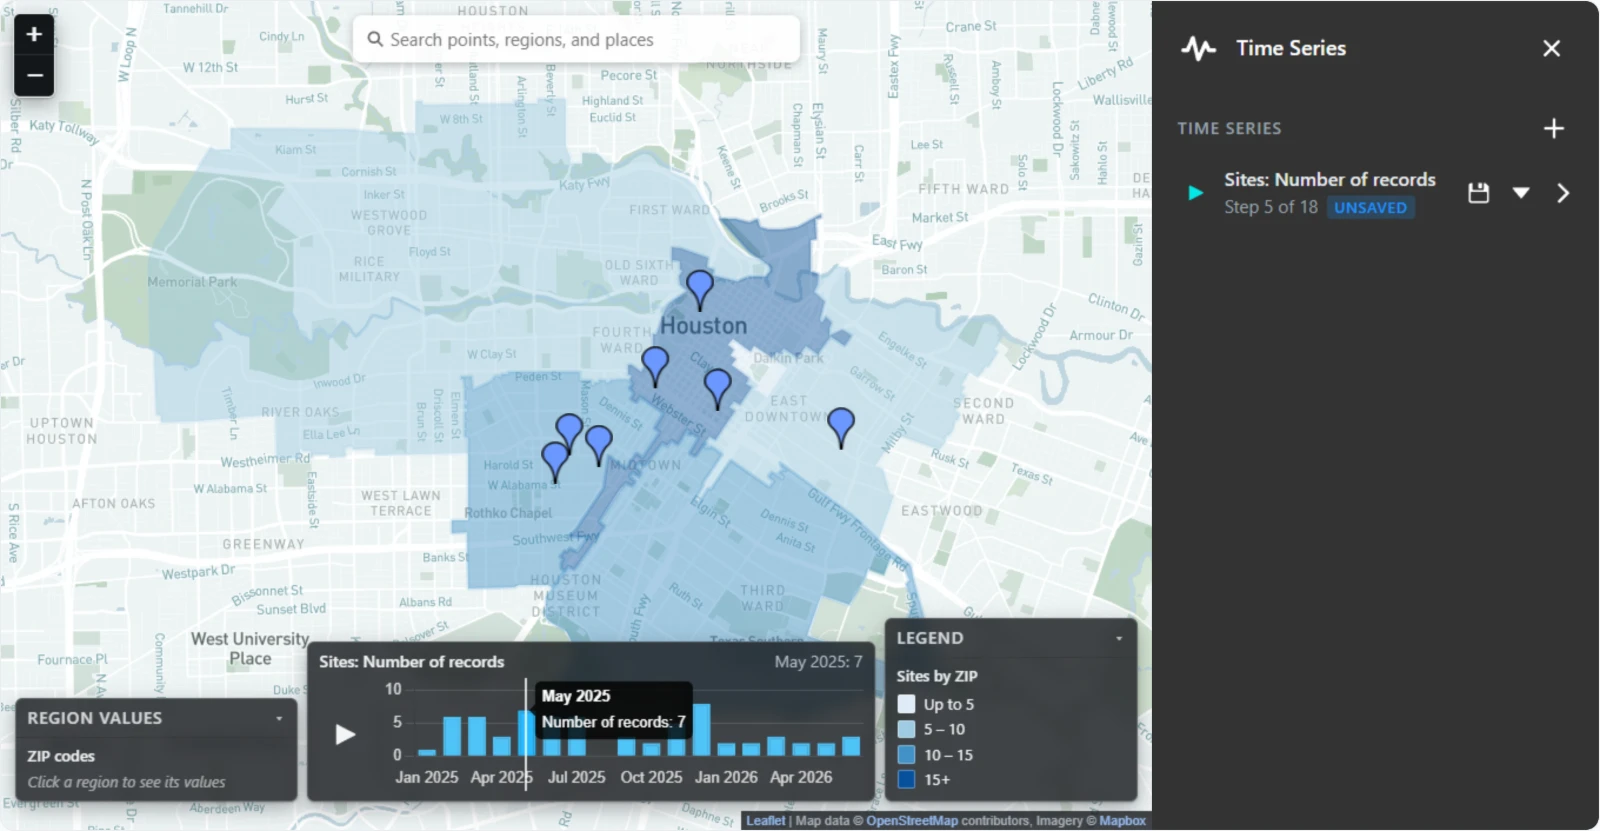
A time series charts a point layer by one of its dates and plays it back on the map.
Building one
- In Time Series, choose + (Build a time series).
- Choose the Layer and its Date field. Mosaic offers the fields whose values read as dates.
- Choose how to Group by: By day, By week, By month, or By year.
- Switch on Show a running total to add each step to the ones before it. Leave it off to chart each step on its own.
- Choose a Measure: Number of records, or the Sum, Average, Minimum, or Maximum of a Field to measure.
- Choose Build.
The series is listed in the panel and drawn on the timeline at the bottom of the map. Its menu has Edit and Delete, and its caret shows its details: its date and step, its first and last steps, and how many records it read and how many had no date or number.
A layer from your organization's records charts by a date field it reads. If it has none, add one with Edit data. See Changing a layer of records.
Playing it back
The timeline shows the series' name, the step showing and its value, a play button, and the chart: bars for steps on their own, or a line for a running total.
- Play steps through the series about once a second, and the map shows each step's points. A finished run starts over.
- Click a step on the chart to jump to it.
- Choose the series' name in the panel to put it on the timeline or take it off. One series shows at a time.
While a step shows, the layer's other points are hidden: that step's points show, or every step up to it for a running total. A region layer filled from those points fills again at each step, so its colors change as the points do. See Filling regions from a point layer.
A series follows your filters. Filtering its layer builds it again from the points that are left.
A saved series is there for everyone who opens the map, including anyone with its link. Someone who can edit the map saves it with its save icon. Everyone else can build series of their own, and the panel says they aren't saved. A map holds up to 20 series.
Settings and Info
Settings has two choices:
- Theme: Light or Dark for the base map. It changes only what you see. Someone who can edit the map keeps a theme for everyone with Save view. See Saving the view.
- Full screen fills your screen with the map, panels and all. Press Esc or choose Exit full screen to leave. Browsers that don't offer it, such as Safari on an iPhone, don't show it.
Info shows the map's name, its organization, and its description.