Making Maps
How to shape a map once its data is on it: saving layers, coloring them, filling regions from points, changing a point, and choosing what the map opens on.
Overview
You change a map if you hold the creator role and the map is yours or shared with you to edit. Everyone else who opens it gets the same panels to look with and nothing that saves. See What you can do.
What you change is yours until you save it. A layer you add, upload, or fill reads Unsaved in Regions & Points, and nobody else sees it until you choose Save to map. Leaving the map with a layer unsaved asks first: Leave this map? You'll lose the layers you haven't saved to it.
How to put data on a map is on Adding Data. This page covers what you do with it there.
Saving layers
Each layer's row in Regions & Points has a menu. What it offers depends on the layer:
| Menu item | What it does |
|---|---|
| Save to map | Keeps a new or changed layer for everyone who opens the map. Shown while the layer reads Unsaved. |
| Edit data | Changes what a layer of your organization's records reads. See Changing a layer of records. |
| Fill from a point layer | Colors a region layer by the points in each region. See below. |
| Settings | The layer's name and how it looks. See A layer's settings. |
| Remove | Takes a layer you haven't saved off the map. |
| Delete | Deletes a saved layer. Mosaic asks first since its data goes for everyone who opens the map. |
A new layer goes at the top of its list, so it draws on top.
To change the order of region layers, drag a row by its handle at the left, or focus the handle and use the up and down arrow keys. The order is kept when you save the view.
A layer's settings
Choose Settings from a layer's menu to open Layer settings. For a layer already saved to the map, Save keeps the change for everyone at once.
A point layer
| Setting | What it does |
|---|---|
| Layer name | The name in Regions & Points, in search results, and in time series. |
| Pin | Blue, Orange, Purple, Red, or Yellow. |
| Fields a pin shows when someone points at it | The fields that show when someone points at a pin. Everything shows when they choose it. |
A region layer
| Setting | What it does |
|---|---|
| Layer name | The name in Regions & Points and on the legend. |
| Region ID label | What a region's ID is, such as "ZIP code" or "County name." It starts each region's tooltip and finishes the legend's title. |
| Legend title | What the colors show, such as "Households served." |
| Color by | What decides each region's color, below. |
| Color scheme | The colors to use, such as Blue or Viridis for numbers, or Mosaic or Pastel for text. |
| Number of buckets | How many ranges a number is split into. |
Color by offers:
- Single color: every region the same color.
- Distinct colors: no value at all. Neighboring regions get different colors, as on a political map, so you can tell them apart. Use it for districts, territories, and other regions whose shapes matter more than any value they hold.
- The layer's values, by the name of its legend, such as Sites: the numbers the layer holds, as from filling it from a point layer or a layer of records.
- Any property the regions carry: numbers are split into ranges, and text gets one color per value.
Text gets only eight colors. Every other value shares a gray. For more than eight, Distinct colors is usually what you want.
Filling regions from a point layer
A region layer can take its colors from a point layer: how many points fall in each region, or the total, average, lowest, or highest of one of their numbers. That turns a layer of sites or clients into a shaded map with no data entry.
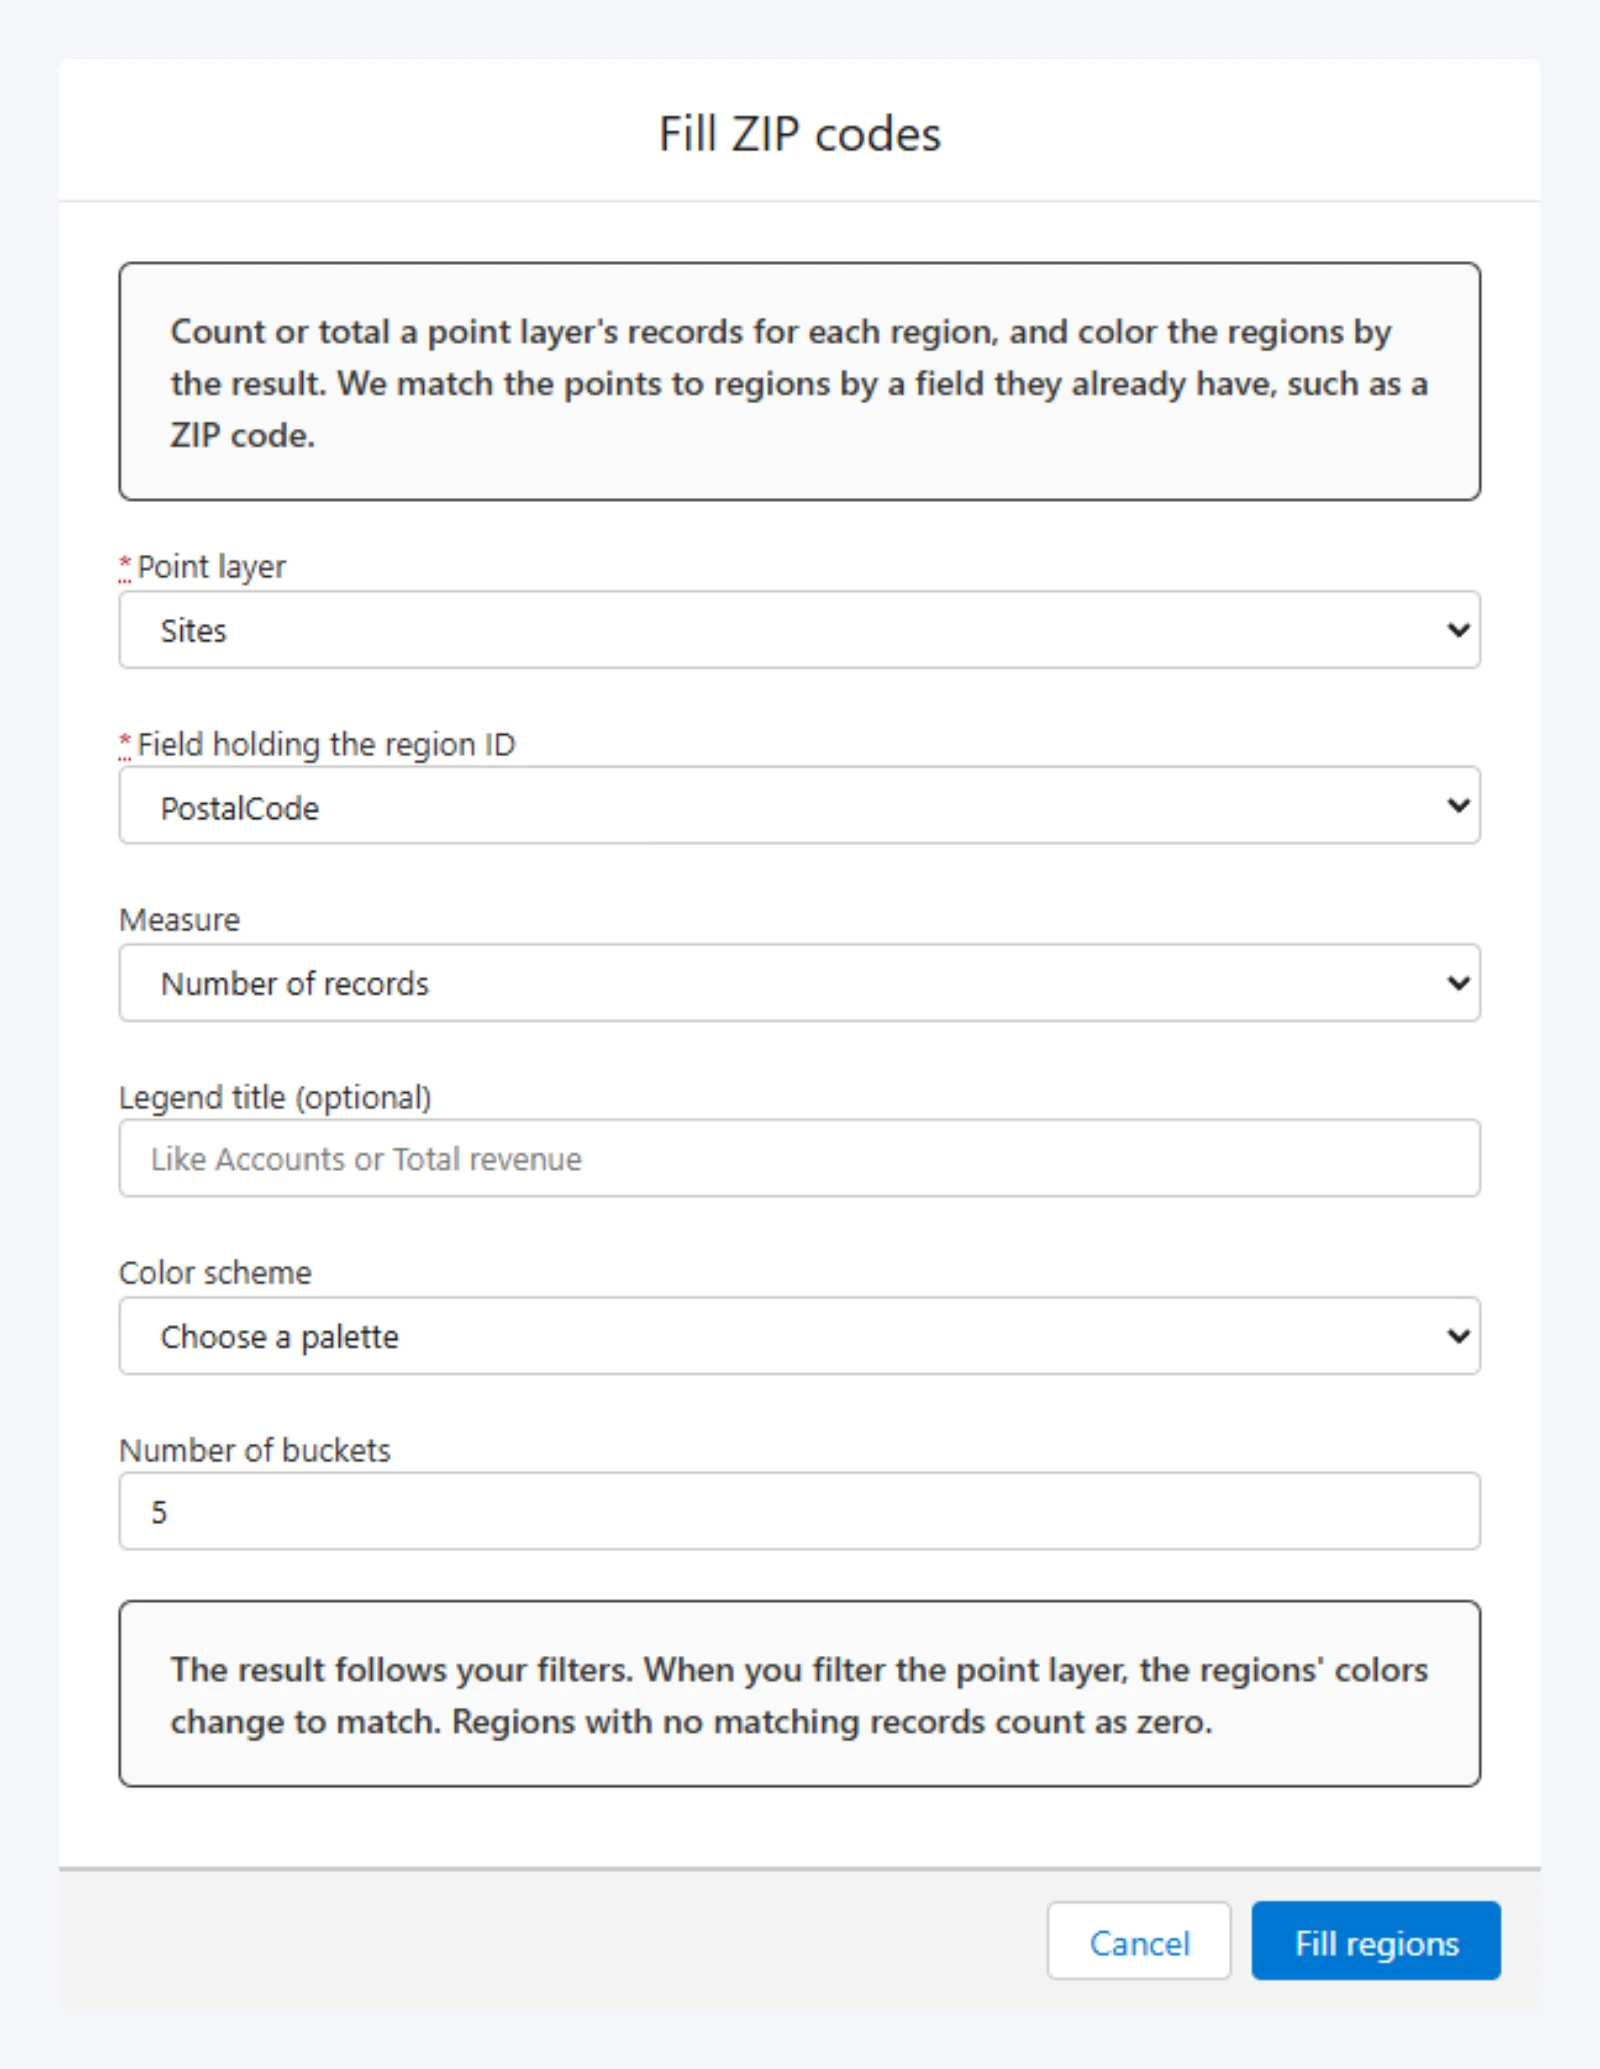
- Choose Fill from a point layer from a region layer's menu.
- Choose the Point layer to count.
- Choose the Field holding the region ID: the field on each point that names its region, such as a ZIP code.
- Choose a Measure. Number of records counts the points. Sum, Average, Minimum, and Maximum ask for a Field to measure.
- If you like, set a Legend title, a Color scheme, and the Number of buckets.
- Choose Fill regions. Mosaic says how many regions it filled from how many records, and how many records named no region.
It follows your filters. The fill counts the points on the map, so filtering the point layer colors the regions to match. Played back, a time series fills them again at each step. Regions with no matching points count as zero.
Anyone who can open the map can fill regions to look at. To keep the result, someone who can edit the map chooses Save to map. A region layer of your organization's records is filled by its own records and doesn't offer it.
Changing a point
Choose a pin and then Edit in Point details to change its fields. Choose Done when you're finished. Mosaic saves the point at once and says We saved your changes. Its pin moves through the layer's filters again, so a point you changed may now be filtered out.
Edit is on the points of every layer the map keeps, such as an upload or a sample. A change to a layer you haven't saved yet is kept when you save the layer. Points from your organization's records have no Edit since each record is changed where it lives.
Saving the view
Save view, at the top of the map's page, sets what everyone sees when they open the map:
- Where it opens: the middle of the map and how far it's zoomed
- Its theme, Light or Dark, as chosen in Settings
- Which saved layers show and the order of its region layers
Move the map and show the layers as you want them, then choose Save view. Mosaic says View saved. The map opens here now. Layers you haven't saved to the map aren't part of the view.
Filters, searches, and pinned places are never part of the view. Each person's are their own.
Saving bookmarks and time series
Bookmark sets and time series are kept with the map, too. Each shows Unsaved until you save it with its save icon, and then everyone who opens the map has it, including anyone with its link. See Bookmarks and Time Series.
Deleting a layer deletes the time series built on it.